SSI Disabled Recipients Who Work, December 2003
Other Work Incentive Participants
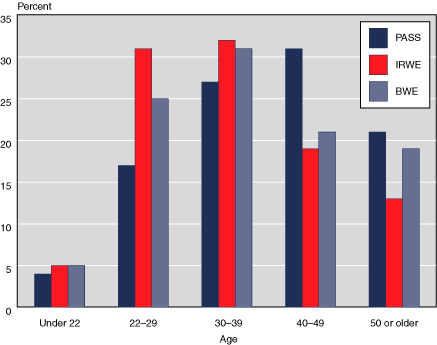
Recipients with income excluded under plans for achieving self-support (PASS), impairment-related work expenses (IRWE), or blind work expenses (BWE) were similar in age to all working recipients (Chart 3). PASS participants were somewhat older—52 percent were aged 40 or older, compared with 32 percent of those with IRWE and 40 percent of those with BWE.

| Age | PASS | IRWE | BWE |
|---|---|---|---|
| Under 22 | 4 | 5 | 5 |
| 22–29 | 17 | 31 | 25 |
| 30–39 | 27 | 32 | 31 |
| 40–49 | 31 | 19 | 21 |
| 50 or older | 21 | 13 | 19 |
| NOTE: PASS = plans to achieve self-support; IRWE = impairment-related work expenses; BWE = blind work expenses. | |||
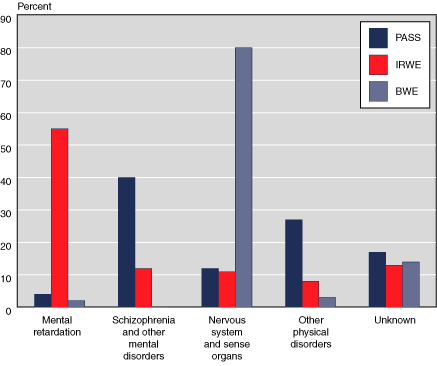
The most frequently identified diagnosis varied among recipients who had income excluded under plans for achieving self-support (PASS), impairment-related work expenses (IRWE), or blind work expenses (BWE). Over half of the recipients who had some income excluded under IRWE were mentally retarded, and 40 percent of those with a PASS had other mental disorders. Four-fifths of those with BWE had a nervous system disorder.

| Diagnostic group | PASS | IRWE | BWE |
|---|---|---|---|
| Mental retardation | 4 | 55 | 2 |
| Other mental disorders | 40 | 12 | 0 |
| Nervous system and sense organs | 12 | 11 | 80 |
| Other physical disorders | 27 | 8 | 3 |
| Unknown | 17 | 13 | 14 |
| NOTE: PASS = plans to achieve self-support; IRWE = impairment-related work expenses; BWE = blind work expenses. | |||
| State or area | Plans for achieving self-support (PASS) a |
Impairment-related work expenses (IRWE) |
Blind work expenses (BWE) |
|---|---|---|---|
| All areas | 1,705 | 7,604 | 3,074 |
| Alabama | 26 | 167 | 29 |
| Alaska | 4 | 6 | 3 |
| Arizona | 19 | 92 | 32 |
| Arkansas | 19 | 84 | 31 |
| California | 511 | 719 | 447 |
| Colorado | 11 | 35 | 36 |
| Connecticut | 9 | 171 | 23 |
| Delaware | 0 | 41 | 9 |
| District of Columbia | b | b | 4 |
| Florida | 61 | 357 | 99 |
| Georgia | 28 | 256 | 60 |
| Hawaii | 9 | 7 | 9 |
| Idaho | 17 | 20 | 9 |
| Illinois | 21 | 283 | 71 |
| Indiana | 6 | 134 | 42 |
| Iowa | 26 | 49 | 73 |
| Kansas | 23 | 308 | 34 |
| Kentucky | 49 | 108 | 48 |
| Louisiana | 3 | 136 | 53 |
| Maine | 34 | 38 | 16 |
| Maryland | 16 | 200 | 49 |
| Massachusetts | 86 | 210 | 260 |
| Michigan | 57 | 191 | 90 |
| Minnesota | 40 | 162 | 66 |
| Mississippi | 7 | 40 | 50 |
| Missouri | 17 | 157 | 57 |
| Montana | 32 | 10 | 10 |
| Nebraska | 12 | 31 | 22 |
| Nevada | 9 | 19 | 13 |
| New Hampshire | 7 | 30 | 11 |
| New Jersey | 16 | 205 | 42 |
| New Mexico | b | 80 | 19 |
| New York | 111 | 609 | 227 |
| North Carolina | 110 | 361 | 117 |
| North Dakota | 7 | 11 | 3 |
| Ohio | 38 | 131 | 110 |
| Oklahoma | 5 | 80 | 23 |
| Oregon | 24 | 42 | 35 |
| Pennsylvania | 18 | 370 | 145 |
| Rhode Island | 8 | 9 | 17 |
| South Carolina | 11 | 80 | 38 |
| South Dakota | 14 | 16 | 6 |
| Tennessee | 15 | 158 | 54 |
| Texas | 31 | 333 | 200 |
| Utah | 4 | 59 | 21 |
| Vermont | 18 | 7 | 6 |
| Virginia | 15 | 555 | 78 |
| Washington | 36 | 109 | 58 |
| West Virginia | 6 | 33 | 22 |
| Wisconsin | 54 | 288 | 93 |
| Wyoming | b | 5 | b |
| Outlying area | |||
| Northern Mariana Islands | 0 | b | b |
| SOURCE: Social Security Administration, Supplemental Security Record (Characteristic Extract Record format), 100 percent data. | |||
| a. Includes 448 persons with a PASS that excludes only resources. | |||
| b. Data are not shown to avoid disclosure of information for particular individuals. | |||
| CONTACT: Clark Pickett (410) 965-9016 or ssi.workers@ssa.gov. | |||
| Characteristic | Plans for achieving self-support (PASS) a |
Impairment-related work expenses (IRWE) |
Blind work expenses (BWE) |
|---|---|---|---|
| Total | 1,705 | 7,604 | 3,074 |
| Age | |||
| Under 18 | 7 | 4 | 3 |
| 18–21 | 66 | 392 | 143 |
| 22–29 | 284 | 2,357 | 761 |
| 30–39 | 455 | 2,399 | 953 |
| 40–49 | 535 | 1,477 | 633 |
| 50–59 | 296 | 688 | 436 |
| 60–64 | 45 | 163 | 90 |
| 65 or older | 17 | 124 | 55 |
| Sex | |||
| Male | 720 | 4,130 | 1,665 |
| Female | 985 | 3,474 | 1,409 |
| Earned income b | |||
| Wages | 444 | 7,539 | 2,973 |
| Self-employment | 86 | 82 | 124 |
| Earnings (dollars) | |||
| None | 1,181 | 0 | 0 |
| 65 or less | 29 | 638 | 213 |
| 66–99 | 11 | 311 | 106 |
| 100–199 | 35 | 1,126 | 285 |
| 200–299 | 59 | 1,024 | 212 |
| 300–399 | 37 | 874 | 202 |
| 400–499 | 52 | 726 | 174 |
| 500–599 | 42 | 635 | 182 |
| 600–699 | 51 | 463 | 162 |
| 700–799 | 29 | 391 | 116 |
| 800–899 | 35 | 252 | 120 |
| 900–999 | 21 | 208 | 117 |
| 1,000 or more | 123 | 956 | 1,185 |
| Unearned income b | |||
| None | 309 | 3,210 | 1,570 |
| Social Security | 1,333 | 3,930 | 1,251 |
| Other pensions | 19 | 59 | 9 |
| Income based on need | 0 | 1 | 0 |
| Asset income | 121 | 684 | 286 |
| Other | 81 | 217 | 128 |
| SOURCE: Social Security Administration, Supplemental Security Record (Characteristic Extract Record format), 100 percent data. | |||
| a. Includes 448 persons with a PASS that excludes only resources. | |||
| b. The sum of the entries may be greater than the total because some recipients may receive more than one type of earned or unearned income or both earned and unearned income. | |||
| CONTACT: Clark Pickett (410) 965-9016 or ssi.workers@ssa.gov. | |||
| Diagnostic group | All blind and disabled recipients | Plans for achieving self-support (PASS) a |
Impairment-related work expenses (IRWE) |
Blind work expenses (BWE) |
|---|---|---|---|---|
| Total | ||||
| Number | 3,953,224 | 1,705 | 7,604 | 3,074 |
| Percent | 100.0 | 100.0 | 100.0 | 100.0 |
| Congenital anomalies | 0.6 | 0.8 | 1.7 | 1.1 |
| Endocrine, nutritional, and metabolic diseases | 3.9 | 2.6 | 0.4 | 0.4 |
| Infectious and parasitic diseases | 1.7 | 2.4 | 0.6 | 0.1 |
| Injuries | 2.6 | 7.7 | 2.2 | 0.1 |
| Mental disorders | ||||
| Retardation | 22.0 | 4.2 | 55.1 | 2.0 |
| Schizophrenia | 10.0 | 10.0 | 3.9 | 0 |
| Other | 24.3 | 29.6 | 8.5 | 0.3 |
| Neoplasms | 1.1 | 0.9 | 0.3 | 0.1 |
| Diseases of the— | ||||
| Blood and blood-forming organs | 0.4 | 0.3 | 0.1 | 0 |
| Circulatory system | 4.7 | 1.3 | 0.7 | 1.2 |
| Digestive system | 0.9 | 0.8 | 0.1 | 0 |
| Genitourinary system | 1.1 | 1.0 | 0.2 | 0.1 |
| Musculoskeletal system and connective tissue | 9.7 | 7.6 | 1.0 | 0.1 |
| Nervous system and sense organs b | 7.8 | 12.1 | 11.4 | 80.3 |
| Respiratory system | 2.1 | 1.2 | 0.2 | 0 |
| Skin and subcutaneous tissue | 0.2 | 0.2 | 0 | 0 |
| Other | 0.2 | 0.1 | 0.2 | 0.2 |
| Unknown | 6.9 | 17.4 | 13.4 | 14.1 |
| SOURCE: Social Security Administration, Supplemental Security Record (Characteristic Extract Record format), 100 percent data. | ||||
| NOTE: Effective with the December 2002 edition, all recipients in each recipient category are included when computing percentages for each diagnostic category. Previously, only recipients with identified diagnoses were included in this computation. | ||||
| a. Includes 448 persons with a PASS that excludes only resources. | ||||
| b. Most disabled recipients classified as blind are included in this category. A few blind recipients with a primary impairment other than diseases of the eye are coded in other categories. Also, a few recipients are classified with diseases of the eye, but their impairment does not meet the definition of blindness. | ||||
| CONTACT: Clark Pickett (410) 965-9016 or ssi.workers@ssa.gov. | ||||
| Amount excluded (dollars) | Plans for achieving self-support (PASS) a |
Impairment-related work expenses (IRWE) |
Blind work expenses (BWE) |
|---|---|---|---|
| Total | |||
| Number | 1,257 | 7,604 | 3,074 |
| Percent | 100.0 | 100.0 | 100.0 |
| Under 25 | 2.7 | 18.9 | 17.9 |
| 25–49 | 1.0 | 25.4 | 10.2 |
| 50–99 | 2.3 | 32.2 | 14.3 |
| 100–199 | 5.6 | 15.6 | 18.4 |
| 200–299 | 9.6 | 3.9 | 11.8 |
| 300–499 | 23.5 | 2.5 | 14.1 |
| 500–999 | 47.7 | 1.2 | 10.1 |
| 1,000 or more | 7.6 | 0.3 | 3.2 |
| SOURCE: Social Security Administration, Supplemental Security Record (Characteristic Extract Record format), 100 percent data. | |||
| a. Data do not include plans for achieving self-support that exclude only resources. | |||
| CONTACT: Clark Pickett (410) 965-9016 or ssi.workers@ssa.gov. | |||