The Distributional Consequences of a "No-Action" Scenario: Updated Results
Policy Brief No. 2005-01 (released July 2005)
This brief updates results from the February 2004 Policy Brief of the same title and presents additional findings.
Under the Social Security program, benefits are paid to retired workers, survivors, and disabled persons out of two trust funds—the Old-Age and Survivors Insurance and the Disability Insurance (OASDI) Trust Funds. In their 2005 report, the Social Security Trustees projected that the combined OASDI trust funds would be exhausted in 2041. Because the trust funds are used to pay benefits, retirement benefits would have to be reduced somewhat in 2041 and more drastically in 2042.
If no action were taken to strengthen Social Security, the benefit reductions necessitated by the exhaustion of the trust funds would double the poverty rate of Social Security beneficiaries aged 64–78 in 2042, from 1.5 percent to 3.3 percent. However, this increased poverty rate would still be lower than the current poverty rate for beneficiaries aged 62–76, which is 4.6 percent. In addition, the trust funds' exhaustion could lead to lower returns on payroll taxes using traditional "money's-worth" measures.
This brief was prepared by staff in the Social Security Administration's Office of Retirement Policy.
Questions about the analysis should be directed to David A. Weaver at 202-358-6252.
The findings and conclusions presented in this brief are those of the authors and do not necessarily represent the views of the Social Security Administration.
Although the possibility that the Social Security trust funds will eventually be exhausted is frequently discussed, little research has been done on the potential consequences of insolvency on retirement benefits and poverty. The following analysis is based on the assumptions underlying the 2002 Social Security Trustees Report, but the results would be similar under the assumptions of the 2005 Trustees Report because projections are qualitatively similar.
Under the intermediate assumptions of both reports, the combined Old-Age and Survivors Insurance and Disability Insurance (OASDI) Trust Funds are projected to be exhausted in 2041. Since the trust funds allow Social Security to pay benefits when program costs exceed tax revenues, benefits would have to be cut once the trust funds were exhausted. Therefore, Social Security would be able to pay only about three-quarters of scheduled benefits in 2042, with further reductions relative to scheduled benefits in future years.1 Under the assumptions of the 2002 Trustees Report, 73 percent of scheduled benefits are payable in 2042.2 This analysis focuses on the effects of the reductions on retirees, but the reductions would apply equally to all types of beneficiaries.
If no action were taken to strengthen Social Security, the benefit reductions caused by exhaustion would double the poverty rate of beneficiaries between the ages of 64 and 78 in 2042. (As discussed later, however, poverty rates are projected to decline over time; thus, even with the trust funds exhausted, the poverty rate of future retirees will be lower than that of today's retirees.) All beneficiaries would have their scheduled benefits cut by 27 percent in 2042. In addition:
- Beneficiaries in the lowest income quintile would experience the greatest percentage drop in total retirement income because they have fewer non–Social Security resources.
- Younger retirees would experience a greater reduction in lifetime benefits than older retirees because they would spend a greater share of their retirement in the postexhaustion period.
- Measures of Social Security's "money's worth," or rate of return, are lower under a payable benefits baseline, which reflects the reductions in benefits resulting from the exhaustion of the trust funds, than under a scheduled benefits baseline. The median rate of return on Social Security taxes for scheduled benefits is 2.9 percent, but it drops to 2.2 percent once the trust funds' exhaustion is taken into account.
Methodology
The estimates in this brief come from Modeling Income in the Near Term (MINT), a computer model that uses matched survey and administrative data to project demographic changes, retirement income, and Social Security benefits.3 MINT is useful because it illustrates the change in poverty rates and total income under the no-action scenario for specific years.
The MINT model projects the earnings of current workers from selected birth cohorts into the future, incorporating projected changes in workforce participation, longevity, and a number of other factors. MINT analysis often focuses on the baby-boom cohorts (1946–1960) in 2022—the year the 1960 birth cohort reaches the early retirement age of 62. For this analysis, the individual earnings records and demographic information in the MINT database are shifted forward 18 years to represent the experiences of persons from the 1964–1978 birth cohorts. Although this method fails to incorporate trends (with the exception of income growing at the rate of average wages), it should nevertheless provide a reasonable representation of the distributional effects of a no-action scenario if, for example, there is only limited progress in closing the income gaps between men and women or whites and nonwhites.4 Although the poverty threshold and Supplemental Security Income benefits increase at the rate of price growth during this period, other income sources, including Social Security benefits, generally increase with wage growth.
The estimates of Social Security's money's worth, or rate of return, are based on the change to average lifetime benefits from the no-action scenario. These lifetime effects are also based on data from the MINT model.
Poverty Rate
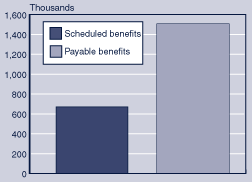
In 2042, with the trust funds exhausted, the poverty rate for beneficiaries between the ages of 64 and 78 in that year would more than double—from 1.5 percent to 3.3 percent (Table 1). (Poverty, however, would still be less common than it is among today's retirees.) The benefit reductions caused by the exhaustion of the Social Security trust funds would put 836,000 additional beneficiaries into poverty, resulting in a total of just over 1.5 million beneficiaries aged 64–78 in poverty in 2042 (Chart 1). Moreover, women and minorities would be overrepresented among the beneficiaries forced into poverty by the benefit cuts. Of the 836,000 additional beneficiaries in poverty in 2042, 43 percent would be black or Hispanic and 64 percent would be women.
| Characteristic | Total | Scheduled benefits | Payable benefits | Increase in poverty | |||
|---|---|---|---|---|---|---|---|
| Number in poverty | Percentage of total | Number in poverty | Percentage of total | Number | Percentage increase | ||
| All beneficiaries aged 64–78 | 45,174 | 672 | 1.5 | 1,508 | 3.3 | 836 | 124.4 |
| By sex | |||||||
| Men | 20,369 | 237 | 1.2 | 542 | 2.7 | 305 | 128.5 |
| Women | 24,805 | 435 | 1.8 | 967 | 3.9 | 532 | 122.2 |
| By race and ethnicity | |||||||
| White | 34,636 | 314 | 0.9 | 751 | 2.2 | 437 | 139.2 |
| Black | 4,196 | 175 | 4.2 | 332 | 7.9 | 157 | 89.3 |
| Hispanic | 4,167 | 141 | 3.4 | 341 | 8.2 | 200 | 141.5 |
| Asian or Native American | 2,175 | 41 | 1.9 | 84 | 3.9 | 43 | 103.5 |
| By marital status | |||||||
| Married | 27,829 | 134 | 0.5 | 302 | 1.1 | 168 | 125.1 |
| Widowed | 7,032 | 145 | 2.1 | 387 | 5.5 | 241 | 165.7 |
| Divorced | 7,739 | 241 | 3.1 | 558 | 7.2 | 317 | 131.2 |
| Never married | 2,574 | 151 | 5.9 | 262 | 10.2 | 111 | 73.2 |
| SOURCE: Social Security Administration estimates based on the Modeling Income in the Near Term (MINT) model. | |||||||
| NOTE: Rounding may cause slight discrepancies in sums and differences. | |||||||
Beneficiaries aged 64–78 in poverty in 2042
Even after the exhaustion of the trust funds forces reductions in benefits, future poverty rates would be relatively low. For example, analysis of MINT data for 2004 found that 4.6 percent of beneficiaries between the ages of 62 and 76 were poor. The reason rates would be low is that the income levels used in measuring the poverty rate rise annually with inflation, while average wages are projected to grow roughly 1 percent faster than inflation. Over time, the poverty rate will tend to fall as a result of this wage/inflation differential. However, the focus of this analysis is not the absolute level of poverty among Social Security beneficiaries but the immediate increase in poverty that would be caused by the sudden exhaustion of the program's trust funds.
Benefits and Retirement Income
The 27 percent cut in benefits resulting from the trust funds' exhaustion would reduce total retirement income by different percentages for various income groups. Beneficiaries in the lowest income quintile would face a 22.2 percent reduction in individual income, compared with a 6.0 percent reduction for those in the highest quintile and an average reduction for all beneficiaries of 14.6 percent (Table 2). The reduction is larger for lower-income beneficiaries because they have fewer non–Social Security sources of retirement income, such as personal savings and employer pensions, and therefore depend on Social Security for a greater percentage of their total income.
| Quintile | Percentage reduction |
|---|---|
| All beneficiaries aged 64–78 | 14.6 |
| Highest | 6.0 |
| Fourth | 10.6 |
| Third | 15.2 |
| Second | 19.5 |
| Lowest | 22.2 |
| SOURCE: Social Security Administration estimates based on the Modeling Income in the Near Term (MINT) model. | |
Although the trust funds' exhaustion would lead to reductions in scheduled benefits (and therefore in retirement income), real benefit levels could be as high as or higher than benefits paid to retirees today. Social Security scheduled benefits are basically designed to replace a given percentage of an individual's preretirement wages. Retirees would receive a lower replacement rate following the trust funds' exhaustion than do current retirees, but they would have substantially higher real preretirement wages as well. Using, for illustrative purposes, the assumptions of the 2005 Trustees Report, a medium-wage worker retiring at age 65 in 2005 after 40 years of work would receive $1,234 per month, while a medium-wage worker retiring at age 65 in 2045 would be scheduled to receive $1,667 per month (in 2005 dollars). Even under the no-action scenario, the new retiree in 2045 would receive a slightly higher benefit ($1,236 a month) than today's new retiree, although that would be a 26 percent reduction from the scheduled benefit level.
Money's-Worth Measures
Money's-worth measures illustrate the relationship between taxes paid into and benefits received from Social Security. Three measures of the money's worth of Social Security are presented.
- Internal rate of return: The real interest rate earned on payroll taxes, defined as the discount rate at which an individual's taxes and benefits are equal in present value.5
- Net present value of lifetime benefits: The discounted present value of lifetime benefits minus the present value of lifetime taxes. A negative value indicates that the present value of taxes would be greater than the present value of benefits. A zero value indicates that the two present values are equal. The present value of lifetime benefits net of taxes illustrates the absolute size of gains or losses to an individual or group over their lifetime.
- Benefit/tax ratio: The ratio of the present value of lifetime benefits to the present value of lifetime taxes. A value of 100 percent indicates that a beneficiary would receive back all taxes paid plus interest at the trust fund rate. The benefit/tax ratio illustrates the relative gains or losses per dollar paid into the program over the lifetime of an individual or group.
These measures of money's worth are calculated for individuals aged 64–78 in 2042 (including persons who have not claimed benefits by that date) using two baselines:
- A scheduled benefits baseline, which represents rates of return that Social Security is scheduled to pay; and
- A payable benefits baseline, which represents rates of return that Social Security can actually pay, assuming that no action is taken and the trust funds are exhausted.
Under all three measures, the money's worth paid from Social Security is lower for payable benefits than for scheduled benefits.
A shared approach to taxes and benefits for married couples was used in calculating money's worth. This approach attributes half of a married couple's earnings and half of all benefits the couple would receive during the marriage to each individual. Implicit in this approach is that spouses share the burden of paying the Social Security tax (in the share of reduced household income while working) as well as the benefits provided by Social Security as a retiree, disabled worker, or survivor. Thus, the shared approach treats the married household as a single unit.
Under the scheduled benefits baseline, individuals aged 64–78 in 2042 would receive a median internal rate of return of 2.9 percent above inflation. Under the payable benefits baseline, this return would decline to an average of 2.2 percent above inflation (Table 3). The net present value of taxes and benefits (in 2004 dollars) would decline from a median loss of $5,844 to a loss of $60,747. Likewise, the scheduled benefit/tax ratio of 96.3 percent, which signifies that individuals would receive benefits equal to 96.3 percent of their contributions, adjusted for interest at the government bond interest rate, would decline to only 77.4 percent under the payable benefits baseline. In all but one category, the net present value of taxes and benefits under the payable benefits baseline would be negative, meaning that individuals would receive less in benefits than they had paid in taxes, adjusted for interest at the government bond rate.
| Characteristic | Total (thousands) | Internal rate of return (percent) | Net present value (2004 dollars) | Benefit/tax ratio | |||
|---|---|---|---|---|---|---|---|
| Scheduled benefits | Payable benefits | Scheduled benefits | Payable benefits | Scheduled benefits | Payable benefits | ||
| All individuals aged 64–78 | 48,634 | 2.9 | 2.2 | −5,844 | −60,747 | 96.3 | 77.4 |
| By sex | |||||||
| Men | 21,891 | 2.2 | 1.5 | −71,446 | −123,217 | 76.3 | 62.1 |
| Women | 26,744 | 3.5 | 2.8 | 41,898 | −13,650 | 115.4 | 92.6 |
| By race and ethnicity | |||||||
| White | 36,491 | 2.8 | 2.2 | −18,631 | −81,615 | 93.6 | 75.2 |
| Black | 4,433 | 3.3 | 2.7 | 20,169 | −20,385 | 108.9 | 88.8 |
| Hispanic | 4,830 | 3.4 | 2.6 | 12,433 | −9,115 | 108.9 | 87.6 |
| Asian or Native American | 2,881 | 3.3 | 2.6 | 0 | −2,452 | 108.4 | 86.5 |
| By marital status | |||||||
| Married | 29,956 | 2.7 | 2.0 | −24,313 | −82,962 | 90.2 | 72.6 |
| Widowed | 7,491 | 3.9 | 3.3 | 74,871 | 16,959 | 131.4 | 107.6 |
| Divorced | 8,213 | 2.9 | 2.3 | −7,514 | −63,183 | 96.6 | 77.1 |
| Never married | 2,974 | 2.6 | 1.9 | −15,697 | −62,138 | 88.3 | 70.9 |
| By age | |||||||
| 64–67 | 16,243 | 2.8 | 1.9 | −12,998 | −84,084 | 93.7 | 70.3 |
| 68–71 | 13,715 | 2.9 | 2.2 | −8,906 | −65,695 | 95.1 | 76.0 |
| 72–74 | 8,884 | 3.0 | 2.4 | −4,626 | −50,259 | 96.7 | 80.2 |
| 75–78 | 9,792 | 3.2 | 2.8 | 0 | −29,540 | 100.8 | 87.7 |
| SOURCE: Social Security Administration estimates based on the Modeling Income in the Near Term (MINT) model. | |||||||
| NOTE: Rounding may cause slight discrepancies in sums and differences. | |||||||
These measures should not be taken as applying to the population as a whole, because of several limitations. First, the sample population includes only individuals who survive to the age of 64. Those who die before 64 tend to receive lower rates of return from Social Security, and thus their exclusion would bias money's-worth measures upward. Second, the sample population does not contain children or disabled beneficiaries under the age of 64. Children and the disabled tend to receive higher rates of return from Social Security, and thus their exclusion would bias money's-worth measures downward. Finally, the sample includes individuals aged only to 78 in the final year of the analysis. Older individuals in 2042 would tend to receive higher rates of return under both the scheduled benefit and the payable benefit baselines. Despite these limitations, however, the money's-worth relationship between the scheduled and payable (no-action scenario) benefit levels would be approximately the same.
Policy Implications
The Social Security trust funds currently collect more money from payroll taxes than they pay out in benefits. If no action is taken, however, that situation will reverse itself several years after the baby-boom generation begins to retire, in 2008.
If no action is taken and benefits are reduced on a proportionate basis when the trust funds become exhausted, total income of those at the lowest economic levels will be affected the most (in percentage terms), significantly increasing the number of individuals in poverty and therefore eligible for Supplemental Security Income or other means-tested benefits.
Notes
1. While there would be only enough revenue available to continue paying a fraction of scheduled benefits, this analysis assumes a proportionate cut in benefits for all beneficiaries. However, this is only one possible option for allocating the benefit reduction among beneficiaries.
2. The corresponding percentage from the 2005 Trustees Report is similar (74 percent). The model used for analysis in this brief has not yet been benchmarked to the 2005 Trustees Report, which is the reason that the assumptions of the 2002 report are used. The February 2004 Policy Brief on this topic used an older version of the model and an earlier set of assumptions by the Trustees.
3. The poverty threshold used for each person is based on family size and elderly status and is indexed to price growth. Household income used to determine poverty status includes earnings, private pension income, income received from annuitizing assets, Social Security benefits, and Supplemental Security Income benefits.
4. A version of the MINT population data set that is currently being developed will correct for the weaknesses of this method and allow for more accurate analysis of retiree populations farther into the future.
5. In some cases, there is more than one discount rate that equalizes the present values of taxes and benefits. These multiple-rate cases and other cases that yield statistically unusable results are excluded from the analysis. To minimize the effect of very large rates of return (principally for individuals who received benefits without paying taxes), rates of return were capped at 400 percent and the median rather than the mean is provided. The median value is the middle value in the distribution; the mean is an average that can be distorted by outlying values.