Trends in the Social Security and Supplemental Security Income Disability Programs
Program Cost and Size
Introduction
This section describes the overall size and cost of the Social Security disability program and the Supplemental Security Income (SSI) program for the disabled. The costs considered include only the costs of the programs' cash benefits; they do not include the administrative costs associated with managing the programs. Except for Chart 10, all data on SSI costs are federal payments only.
The section first examines trends in the cost of these programs and then seeks to determine how these trends are generated, looking initially at trends in the number of disabled beneficiaries (and dependents) and SSI recipients and then at the trends in average cost per individual over time. It also looks at the cost and size of the Medicare and Medicaid programs.
Costs for each of the programs have risen dramatically over time: in nominal dollars, in real (inflation-adjusted) dollars, and as a percentage of gross domestic product. The programs have grown in terms of numbers of beneficiaries and recipients; relative to the eligible population, however, the programs have tended to go through periods of contraction and expansion. Perhaps the most significant finding is that the costs of health coverage for the disabled under Medicare and, even more dramatically, Medicaid are rising faster than the cost of the disability programs' cash benefits.
Social Security Disability
Total cost of benefits
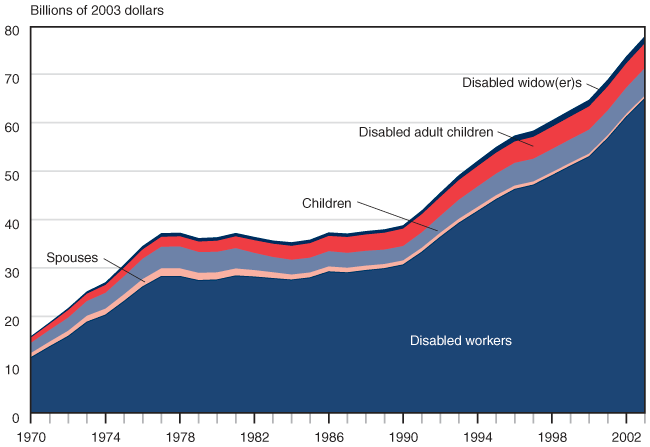
The total cost of cash benefits for the Social Security disability program has increased dramatically since its inception. Since 1990 the total cost of disability has risen 93 percent in real terms (160 percent in nominal terms).
| Year disabled | Disabled workers |
Spouses | Children | Disabled adult children |
Disabled widow(er)s |
|---|---|---|---|---|---|
| 1970 | 11,336 | 764 | 2,102 | 1,101 | 225 |
| 1971 | 13,578 | 861 | 2,417 | 1,251 | 275 |
| 1972 | 15,724 | 971 | 2,702 | 1,568 | 366 |
| 1973 | 18,653 | 1,121 | 3,032 | 1,534 | 419 |
| 1974 | 20,106 | 1,136 | 3,267 | 1,634 | 494 |
| 1975 | 22,940 | 1,278 | 3,723 | 1,773 | 601 |
| 1976 | 25,935 | 1,416 | 4,205 | 1,919 | 667 |
| 1977 | 28,063 | 1,499 | 4,461 | 2,046 | 708 |
| 1978 | 28,081 | 1,473 | 4,511 | 2,108 | 701 |
| 1979 | 27,232 | 1,396 | 4,311 | 2,153 | 676 |
| 1980 | 27,370 | 1,362 | 4,235 | 2,295 | 670 |
| 1981 | 28,192 | 1,341 | 4,188 | 2,446 | 648 |
| 1982 | 27,968 | 1,231 | 3,541 | 2,623 | 638 |
| 1983 | 27,647 | 1,104 | 3,144 | 2,749 | 610 |
| 1984 | 27,344 | 938 | 3,047 | 2,874 | 702 |
| 1985 | 27,793 | 919 | 3,050 | 3,000 | 683 |
| 1986 | 29,036 | 912 | 3,152 | 3,150 | 685 |
| 1987 | 28,832 | 850 | 3,076 | 3,273 | 680 |
| 1988 | 29,312 | 809 | 3,057 | 3,375 | 659 |
| 1989 | 29,690 | 764 | 2,976 | 3,492 | 654 |
| 1990 | 30,459 | 731 | 2,974 | 3,590 | 649 |
| 1991 | 33,062 | 735 | 3,173 | 3,743 | 747 |
| 1992 | 36,179 | 743 | 3,459 | 3,908 | 865 |
| 1993 | 39,076 | 723 | 3,934 | 4,055 | 968 |
| 1994 | 41,503 | 713 | 4,220 | 4,198 | 1,059 |
| 1995 | 43,956 | 693 | 4,456 | 4,323 | 1,142 |
| 1996 | 46,046 | 598 | 4,688 | 4,414 | 1,195 |
| 1997 | 46,941 | 547 | 4,682 | 4,528 | 1,238 |
| 1998 | 48,877 | 514 | 4,778 | 4,611 | 1,277 |
| 1999 | 50,876 | 474 | 4,861 | 4,692 | 1,306 |
| 2000 | 52,799 | 446 | 4,946 | 4,800 | 1,331 |
| 2001 | 56,577 | 434 | 5,128 | 4,956 | 1,372 |
| 2002 | 60,994 | 431 | 5,435 | 5,010 | 1,389 |
| 2003 | 64,811 | 431 | 5,664 | 5,122 | 1,416 |
The cost of Social Security disability benefits in constant dollars has increased over time, though not consistently.1 Benefit costs grew rapidly during the 1970s and peaked in 1978. A decline in those costs occurred in the early 1980s as the result of changes in program administration that reduced the number of applications and awards as well as the number of disabled-worker beneficiaries. By the late 1980s, benefit costs had begun to increase again, and they continue to rise. The largest increase in cost is among disabled-worker beneficiaries, who accounted for nearly $65 billion of the total $77 billion in 2003.
Number of beneficiaries
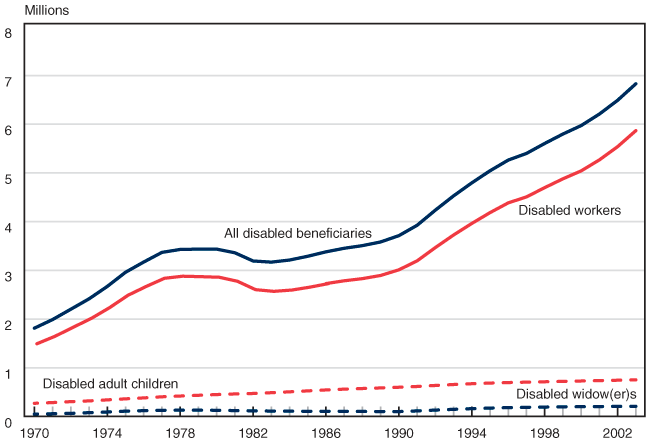
Much of the increase in costs for Social Security disability benefits is due to increases in the number of beneficiaries. Since 1990, the number of disabled-worker beneficiaries has increased 84 percent; disabled widow(er)s, 105 percent; and disabled adult children, 24 percent.
| Year | All disabled beneficiaries |
Disabled workers |
Disabled adult children |
Disabled widow(er)s |
|---|---|---|---|---|
| 1970 | 1.81 | 1.49 | 0.27 | 0.05 |
| 1971 | 1.99 | 1.65 | 0.29 | 0.06 |
| 1972 | 2.20 | 1.83 | 0.31 | 0.06 |
| 1973 | 2.42 | 2.02 | 0.32 | 0.08 |
| 1974 | 2.67 | 2.24 | 0.34 | 0.09 |
| 1975 | 2.96 | 2.49 | 0.36 | 0.11 |
| 1976 | 3.17 | 2.67 | 0.38 | 0.12 |
| 1977 | 3.37 | 2.84 | 0.40 | 0.13 |
| 1978 | 3.43 | 2.88 | 0.42 | 0.13 |
| 1979 | 3.44 | 2.87 | 0.44 | 0.13 |
| 1980 | 3.44 | 2.86 | 0.45 | 0.13 |
| 1981 | 3.36 | 2.78 | 0.46 | 0.12 |
| 1982 | 3.19 | 2.60 | 0.47 | 0.12 |
| 1983 | 3.17 | 2.57 | 0.49 | 0.11 |
| 1984 | 3.21 | 2.60 | 0.51 | 0.11 |
| 1985 | 3.29 | 2.66 | 0.53 | 0.11 |
| 1986 | 3.38 | 2.73 | 0.55 | 0.11 |
| 1987 | 3.45 | 2.79 | 0.56 | 0.11 |
| 1988 | 3.51 | 2.83 | 0.57 | 0.10 |
| 1989 | 3.58 | 2.90 | 0.59 | 0.10 |
| 1990 | 3.71 | 3.01 | 0.60 | 0.10 |
| 1991 | 3.93 | 3.19 | 0.62 | 0.11 |
| 1992 | 4.24 | 3.47 | 0.64 | 0.13 |
| 1993 | 4.53 | 3.73 | 0.66 | 0.15 |
| 1994 | 4.80 | 3.96 | 0.67 | 0.16 |
| 1995 | 5.04 | 4.19 | 0.69 | 0.17 |
| 1996 | 5.26 | 4.39 | 0.70 | 0.18 |
| 1997 | 5.40 | 4.51 | 0.70 | 0.19 |
| 1998 | 5.61 | 4.70 | 0.71 | 0.19 |
| 1999 | 5.80 | 4.88 | 0.72 | 0.20 |
| 2000 | 5.97 | 5.04 | 0.73 | 0.20 |
| 2001 | 6.21 | 5.27 | 0.74 | 0.20 |
| 2002 | 6.49 | 5.54 | 0.74 | 0.21 |
| 2003 | 6.83 | 5.87 | 0.75 | 0.21 |
The number of disabled beneficiaries in each beneficiary category is shown for the period 1970–2003. All of the categories have shown steady increases in the number of beneficiaries, with few exceptions. One exception is the period of the early 1980s, when the number of disabled workers declined as the result of changes in the structure of benefits in the 1977 and 1980 Amendments and increased stringency in adjudicating claims and conducting continuing disability reviews.
Number of disabled-worker beneficiaries
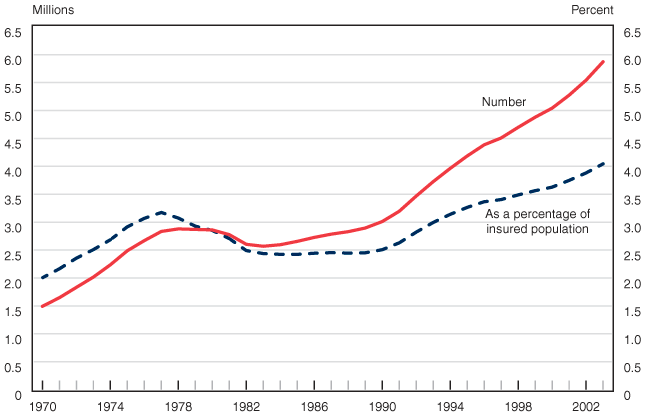
Although the number of disabled workers has been increasing since 1983, their growth as a percentage of the insured population has been considerably slower.
| Year | Number (in millions) |
As a percentage of insured population (in percent) |
|---|---|---|
| 1970 | 1.49 | 2.00 |
| 1971 | 1.65 | 2.17 |
| 1972 | 1.83 | 2.36 |
| 1973 | 2.02 | 2.51 |
| 1974 | 2.24 | 2.69 |
| 1975 | 2.49 | 2.92 |
| 1976 | 2.67 | 3.07 |
| 1977 | 2.83 | 3.17 |
| 1978 | 2.88 | 3.07 |
| 1979 | 2.87 | 2.93 |
| 1980 | 2.86 | 2.85 |
| 1981 | 2.78 | 2.71 |
| 1982 | 2.60 | 2.49 |
| 1983 | 2.57 | 2.44 |
| 1984 | 2.60 | 2.42 |
| 1985 | 2.66 | 2.42 |
| 1986 | 2.73 | 2.44 |
| 1987 | 2.79 | 2.45 |
| 1988 | 2.83 | 2.45 |
| 1989 | 2.90 | 2.45 |
| 1990 | 3.01 | 2.51 |
| 1991 | 3.19 | 2.63 |
| 1992 | 3.47 | 2.82 |
| 1993 | 3.73 | 3.00 |
| 1994 | 3.96 | 3.14 |
| 1995 | 4.19 | 3.26 |
| 1996 | 4.39 | 3.37 |
| 1997 | 4.51 | 3.40 |
| 1998 | 4.70 | 3.49 |
| 1999 | 4.88 | 3.56 |
| 2000 | 5.04 | 3.63 |
| 2001 | 5.27 | 3.75 |
| 2002 | 5.54 | 3.88 |
| 2003 | 5.87 | 4.05 |
When considered relative to the number of workers insured in the event of disability, the growth in disabled workers has been more moderate than what is suggested by raw numbers. After a period of stability (in terms of the number of beneficiaries relative to the number insured for disability) between 1982 and 1989, the program is again growing. A number of factors are contributing to this increase, including the aging of the baby boomers into more disability-prone years. (The baby-boom generation was born after World War II, between 1946 and 1964. The number of births peaked in 1957.)
Average cost per beneficiary
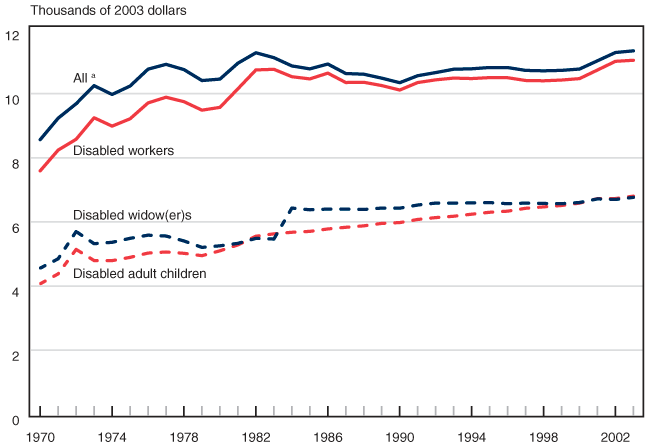
In real terms, the average cost per beneficiary of all Social Security disability cash benefits has increased 33 percent since 1970. Yet the average costs for disabled workers and disabled widow(er)s were relatively stable from the mid-1980s until recently. Thus, increased benefit costs are not strictly due to increasing numbers of beneficiaries.
| Year | All a | Disabled workers |
Disabled adult children |
Disabled widow(er)s |
|---|---|---|---|---|
| 1970 | 8,565.49 | 7,592.92 | 4,068.02 | 4,556.52 |
| 1971 | 9,236.73 | 8,240.73 | 4,378.53 | 4,848.73 |
| 1972 | 9,686.76 | 8,578.70 | 5,141.88 | 5,700.32 |
| 1973 | 10,250.60 | 9,249.80 | 4,793.77 | 5,320.05 |
| 1974 | 9,976.42 | 8,988.45 | 4,791.84 | 5,363.59 |
| 1975 | 10,239.25 | 9,217.20 | 4,893.44 | 5,487.28 |
| 1976 | 10,766.13 | 9,712.73 | 5,028.12 | 5,586.39 |
| 1977 | 10,916.27 | 9,890.44 | 5,061.36 | 5,559.61 |
| 1978 | 10,752.04 | 9,750.96 | 5,019.69 | 5,405.29 |
| 1979 | 10,410.42 | 9,486.45 | 4,946.53 | 5,205.09 |
| 1980 | 10,456.30 | 9,574.18 | 5,098.46 | 5,253.93 |
| 1981 | 10,953.15 | 10,153.73 | 5,282.20 | 5,330.92 |
| 1982 | 11,277.33 | 10,742.02 | 5,553.24 | 5,486.21 |
| 1983 | 11,124.48 | 10,761.58 | 5,627.92 | 5,465.33 |
| 1984 | 10,867.17 | 10,531.02 | 5,676.63 | 6,431.84 |
| 1985 | 10,775.20 | 10,461.86 | 5,704.42 | 6,378.96 |
| 1986 | 10,926.12 | 10,641.89 | 5,779.98 | 6,399.45 |
| 1987 | 10,630.26 | 10,349.27 | 5,832.20 | 6,398.79 |
| 1988 | 10,608.78 | 10,356.60 | 5,877.00 | 6,387.95 |
| 1989 | 10,485.72 | 10,254.22 | 5,953.79 | 6,431.75 |
| 1990 | 10,343.71 | 10,114.95 | 5,978.77 | 6,428.74 |
| 1991 | 10,561.77 | 10,348.16 | 6,076.05 | 6,526.64 |
| 1992 | 10,659.32 | 10,433.01 | 6,134.66 | 6,587.25 |
| 1993 | 10,764.16 | 10,487.45 | 6,176.71 | 6,586.27 |
| 1994 | 10,777.63 | 10,472.64 | 6,240.34 | 6,593.46 |
| 1995 | 10,817.87 | 10,502.53 | 6,300.54 | 6,603.11 |
| 1996 | 10,816.40 | 10,499.29 | 6,334.99 | 6,567.86 |
| 1997 | 10,727.41 | 10,412.53 | 6,425.03 | 6,586.78 |
| 1998 | 10,714.29 | 10,403.12 | 6,468.83 | 6,575.40 |
| 1999 | 10,728.01 | 10,426.53 | 6,512.60 | 6,569.12 |
| 2000 | 10,769.71 | 10,471.10 | 6,587.26 | 6,604.90 |
| 2001 | 11,027.38 | 10,739.68 | 6,728.42 | 6,717.30 |
| 2002 | 11,285.55 | 11,010.59 | 6,729.31 | 6,700.60 |
| 2003 | 11,337.70 | 11,043.80 | 6,804.00 | 6,765.60 |
The average cash benefit cost per disabled beneficiary has generally risen during the period 1970–2003, although the cost declined slightly in the early 1980s. The increase in average benefits in the early to mid-1970s was probably related to ad hoc benefit increases of 15 percent, 10 percent, and 20 percent that became effective in January 1970, January 1971, and September 1972, respectively. An additional ad hoc benefit increase of 11 percent occurred in two steps in March and June 1974. Legislation in 1972 resulted in an automatic benefit adjustment for annual increases in the consumer price index beginning in June 1975. Although this adjustment was intended to stabilize benefits, the way the adjustment was made resulted in overcompensation for inflation, because it did not factor in inflation-related wage increases.
In the late 1970s and early 1980s, there were small reductions in average benefit costs, probably because of changes in the benefit computation that applied to future beneficiaries. These changes, enacted in 1977, 1980, and 1981, "decoupled" the benefit formula from wages to end the "double indexing" from the 1972 legislation, capped family benefits and reduced dropout years, and eliminated the minimum benefit, respectively. Delaying scheduled cost-of-living adjustments in 1983 may have also contributed to this result. From the late 1980s to the late 1990s, the average cost was fairly stable for disabled workers and disabled widow(er)s, while benefits for disabled adult children rose. The stability of the average cost over 20 years is surprising, since benefit calculations are wage indexed and would tend to increase benefits over time. It has been suggested that lower-wage workers have been increasingly attracted to the disability rolls because of implicit increases in replacement rates for low earners resulting from increasing disparity in the wage distribution. This could help explain the stability of costs per beneficiary during this period. Similarly, increases in the number of women insured for disability, whose numbers are a growing portion of the total number of disabled, could also account for this result, since women, on average, have lower earnings than do men. Further research is required to fully understand the underlying patterns affecting average benefit costs.
The cost per beneficiary for disabled adult children, on the other hand, has increased the most (67 percent) during this period. Since 2000, the average benefit cost for workers and widow(er)s has begun to increase. One possible reason for the increase in the cost per beneficiary is that wage increases exceeded price increases in the mid- to late 1990s, yielding higher real benefits. The average expenditure on all disability benefits, including benefits to dependents, increased by a third from 1970 to 2003, but more slowly (10 percent) between 1990 and 2003.
Beneficiaries also receiving Supplemental Security Income
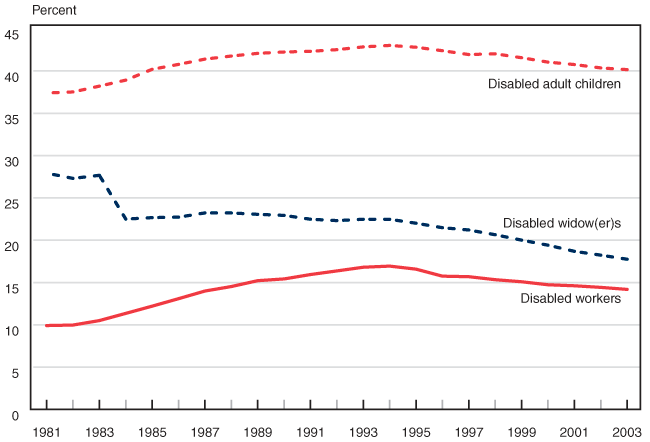
The rates of concurrency reached a peak for disabled workers and disabled adult children in the mid-1990s and have decreased slightly since then. The rate of concurrency for disabled widow(er)s declined abruptly in 1983 because of a change in the benefit calculation and generally has continued to decline.
| Year | Disabled workers |
Disabled adult children |
Disabled widow(er)s |
|---|---|---|---|
| 1981 | 9.92 | 36.84 | 27.93 |
| 1982 | 9.98 | 36.98 | 27.31 |
| 1983 | 10.50 | 37.67 | 27.67 |
| 1984 | 11.35 | 38.38 | 22.50 |
| 1985 | 12.21 | 39.62 | 22.67 |
| 1986 | 13.09 | 40.19 | 22.73 |
| 1987 | 14.00 | 40.81 | 23.23 |
| 1988 | 14.53 | 41.15 | 23.22 |
| 1989 | 15.22 | 41.46 | 23.06 |
| 1990 | 15.43 | 41.63 | 22.94 |
| 1991 | 15.94 | 41.71 | 22.48 |
| 1992 | 16.37 | 41.90 | 22.32 |
| 1993 | 16.81 | 42.23 | 22.48 |
| 1994 | 16.94 | 42.41 | 22.47 |
| 1995 | 16.58 | 42.22 | 22.01 |
| 1996 | 15.75 | 41.85 | 21.48 |
| 1997 | 15.69 | 41.44 | 21.21 |
| 1998 | 15.34 | 41.40 | 20.65 |
| 1999 | 15.09 | 40.97 | 20.01 |
| 2000 | 14.74 | 40.46 | 19.41 |
| 2001 | 14.62 | 40.19 | 18.69 |
| 2002 | 14.43 | 39.78 | 18.23 |
The rate of concurrency, that is, the percentage of Social Security disability beneficiaries who also receive SSI for the blind and disabled, increased for disabled workers and disabled adult children until the mid-1990s and has decreased slightly since then. The change was particularly large for disabled workers, with an increase from 10 percent receiving SSI payments in 1981 to 17 percent in 1993. Since then, the rate has fallen to 14 percent.
A policy change in 1983, which changed the actuarial reduction for disabled widow(er)s under the age of 60, resulted in an abrupt decline in the percentage receiving SSI. That change capped the actuarial reduction for disabled widow(er)s aged 50–59 at the level of reduction effective for widow(er)s at age 60, resulting in increased benefits for disabled widow(er)s younger than 60. The percentage of disabled widow(er)s receiving SSI payments has generally continued to decline since that time.
Medicare for the Disabled
Total cost of benefits
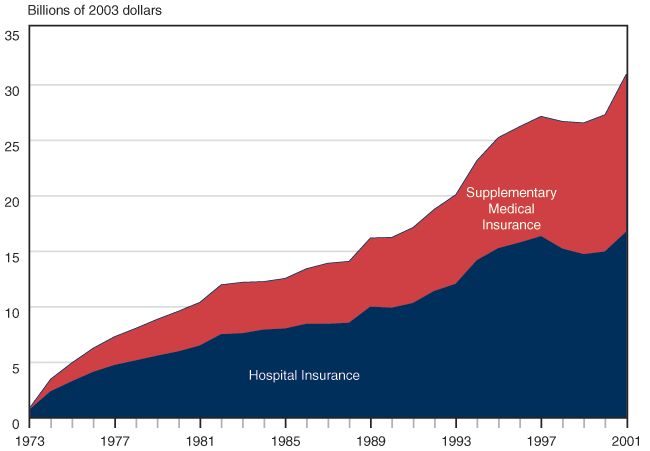
The cost of Medicare benefits, which are provided to disabled Social Security beneficiaries (but not to dependents) after a 24-month waiting period, has been rising dramatically, with costs increasing 90 percent in real terms between 1990 and 2001.
| Year | Hospital Insurance |
Supplementary Medical Insurance |
|---|---|---|
| 1973 | 0.69 | 0.16 |
| 1974 | 2.36 | 1.13 |
| 1975 | 3.26 | 1.70 |
| 1976 | 4.11 | 2.17 |
| 1977 | 4.73 | 2.58 |
| 1978 | 5.15 | 2.92 |
| 1979 | 5.57 | 3.31 |
| 1980 | 5.96 | 3.65 |
| 1981 | 6.48 | 3.92 |
| 1982 | 7.50 | 4.48 |
| 1983 | 7.59 | 4.62 |
| 1984 | 7.92 | 4.36 |
| 1985 | 8.02 | 4.54 |
| 1986 | 8.44 | 4.99 |
| 1987 | 8.44 | 5.49 |
| 1988 | 8.53 | 5.57 |
| 1989 | 9.98 | 6.22 |
| 1990 | 9.89 | 6.37 |
| 1991 | 10.31 | 6.83 |
| 1992 | 11.40 | 7.39 |
| 1993 | 12.04 | 8.05 |
| 1994 | 14.17 | 9.02 |
| 1995 | 15.25 | 10.00 |
| 1996 | 15.76 | 10.48 |
| 1997 | 16.33 | 10.83 |
| 1998 | 15.21 | 11.49 |
| 1999 | 14.71 | 11.86 |
| 2000 | 14.95 | 12.35 |
| 2001 | 16.73 | 14.23 |
Medicare is provided to Social Security disabled beneficiaries (but not to dependents) after a 24-month waiting period. Medicare Hospital Insurance (Part A) is provided for free, but Supplementary Medical Insurance (Part B), which covers doctor bills, requires a monthly premium paid by the beneficiary or on the beneficiary's behalf.
Medicare benefit costs for the disabled have been rising dramatically, with costs increasing by 90 percent in real terms between 1990 and 2001. Supplementary Medical Insurance has been increasing as a share of all Medicare costs, rising from 34 percent of total cost in 1975, to 39 percent in 1990, and to 46 percent in 2001. Much of the increase in the cost of Medicare is due to an increase in the number of Medicare beneficiaries. However, the increasing cost in medical services has also contributed to the overall increase in benefit costs.
Number of beneficiaries
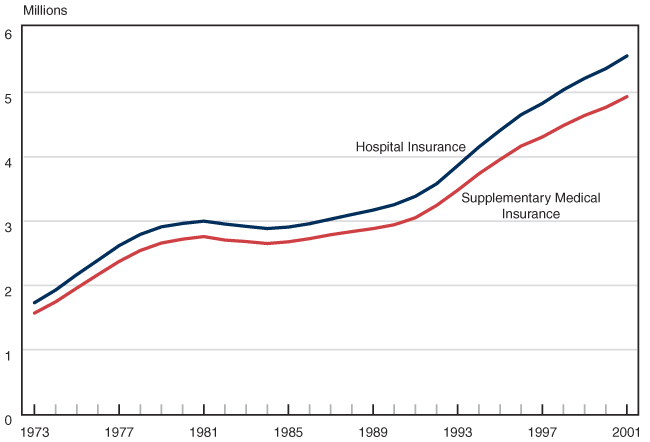
The number of disabled Medicare beneficiaries has increased in conjunction with the increase in disabled Social Security beneficiaries, up nearly 70 percent since 1990 (see Chart 2). The proportion of Medicare beneficiaries with Supplementary Medical Insurance has declined since the mid-1980s.
| Year | Hospital Insurance |
Supplementary Medical Insurance |
|---|---|---|
| 1973 | 1.73 | 1.57 |
| 1974 | 1.93 | 1.75 |
| 1975 | 2.17 | 1.96 |
| 1976 | 2.39 | 2.17 |
| 1977 | 2.62 | 2.37 |
| 1978 | 2.79 | 2.54 |
| 1979 | 2.91 | 2.66 |
| 1980 | 2.96 | 2.72 |
| 1981 | 3.00 | 2.76 |
| 1982 | 2.95 | 2.71 |
| 1983 | 2.92 | 2.68 |
| 1984 | 2.88 | 2.65 |
| 1985 | 2.91 | 2.68 |
| 1986 | 2.96 | 2.73 |
| 1987 | 3.03 | 2.79 |
| 1988 | 3.10 | 2.84 |
| 1989 | 3.17 | 2.88 |
| 1990 | 3.26 | 2.94 |
| 1991 | 3.39 | 3.05 |
| 1992 | 3.58 | 3.24 |
| 1993 | 3.86 | 3.48 |
| 1994 | 4.15 | 3.74 |
| 1995 | 4.41 | 3.96 |
| 1996 | 4.65 | 4.17 |
| 1997 | 4.83 | 4.31 |
| 1998 | 5.04 | 4.49 |
| 1999 | 5.22 | 4.64 |
| 2000 | 5.37 | 4.77 |
| 2001 | 5.57 | 4.93 |
| Year | SMI premium (2003 dollars) |
Percentage with SMI |
|---|---|---|
| 1973 | 25.13 | 90.70 |
| 1974 | 23.79 | 90.51 |
| 1975 | 22.25 | 90.36 |
| 1976 | 22.80 | 90.64 |
| 1977 | 22.85 | 90.61 |
| 1978 | 22.32 | 91.05 |
| 1979 | 20.90 | 91.34 |
| 1980 | 20.50 | 91.77 |
| 1981 | 21.57 | 92.00 |
| 1982 | 23.04 | 91.57 |
| 1983 | 22.20 | 91.91 |
| 1984 | 25.55 | 91.92 |
| 1985 | 26.14 | 92.12 |
| 1986 | 25.85 | 92.16 |
| 1987 | 28.59 | 91.98 |
| 1988 | 37.93 | 91.46 |
| 1989 | 46.62 | 90.92 |
| 1990 | 39.39 | 90.41 |
| 1991 | 39.96 | 90.16 |
| 1992 | 41.30 | 90.61 |
| 1993 | 46.26 | 90.09 |
| 1994 | 50.60 | 89.98 |
| 1995 | 55.35 | 89.73 |
| 1996 | 49.39 | 89.54 |
| 1997 | 50.05 | 89.19 |
| 1998 | 49.25 | 88.99 |
| 1999 | 49.83 | 88.94 |
| 2000 | 48.19 | 88.79 |
| 2001 | 52.15 | 88.63 |
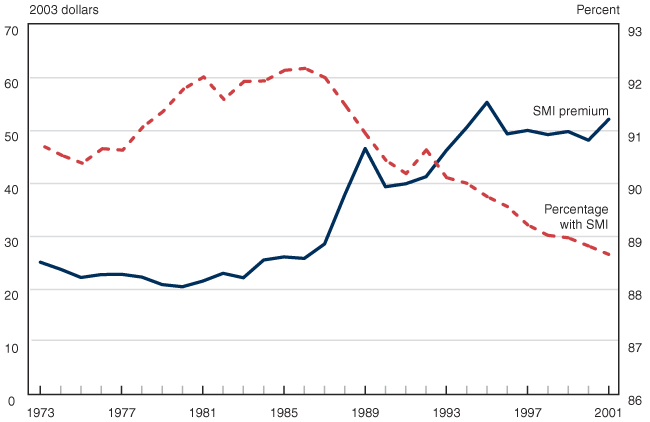
The number of disabled Medicare beneficiaries has increased in near lockstep with the increase in disabled Social Security beneficiaries, and it is up nearly 70 percent since 1990 (Chart 7). The proportion of disabled Medicare beneficiaries with Supplementary Medical Insurance (SMI) has varied over time (Chart 8). SMI coverage increased from 90.4 percent in 1975 to a peak of more than 92 percent in the mid- and late 1980s and dropped fairly consistently to a historical low of 88.6 percent in 2001.
It is unclear why fewer persons are electing SMI coverage, although the cost of premiums for individuals has been rising. For some low-income Medicare beneficiaries, special state programs funded through Medicaid pay all or part of the premium for SMI, making the decline in SMI coverage even more surprising. In 1988, the Qualified Medicare Beneficiary program mandated that states use Medicaid to pay all Medicare cost sharing (including Part B premiums) for Medicare beneficiaries with income less than 100 percent of poverty and resources less than twice the SSI resource limit. Beginning in 1990, the Specified Low-income Medicare Beneficiary program mandated that states pay the Part B premium for Medicare beneficiaries who are between 100 percent and 120 percent of poverty and whose resources are less than twice the SSI resource limit. In recent years, the proportion of disabled SMI enrollees who received this state SMI buy-in has risen slightly, from 39.7 percent in 1998 to 41.2 percent in 2001, yet overall SMI enrollment continues to decline.
Average cost per beneficiary
The average cost of Medicare benefits for disabled Medicare beneficiaries has generally increased over time; however, in the late 1990s, reductions in hospital payments helped reduce average Medicare costs, although costs are once again rising. Average Supplementary Medical Insurance benefits have increased consistently during this period.
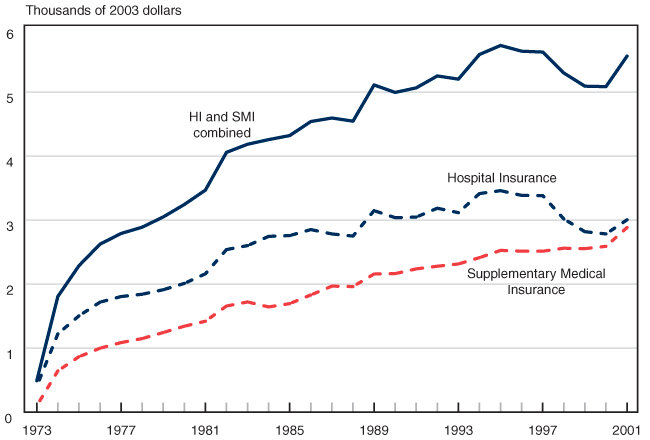
| Year | HI and SMI combined |
Hospital Insurance |
Supplementary Medical Insurance |
|---|---|---|---|
| 1973 | 490.87 | 400.99 | 99.09 |
| 1974 | 1,806.84 | 1,222.98 | 645.09 |
| 1975 | 2,286.82 | 1,504.13 | 866.20 |
| 1976 | 2,623.89 | 1,718.37 | 999.08 |
| 1977 | 2,791.02 | 1,806.29 | 1,086.82 |
| 1978 | 2,888.98 | 1,842.16 | 1,149.73 |
| 1979 | 3,049.19 | 1,912.55 | 1,244.36 |
| 1980 | 3,243.36 | 2,010.88 | 1,343.08 |
| 1981 | 3,468.22 | 2,161.34 | 1,420.56 |
| 1982 | 4,057.91 | 2,539.71 | 1,657.95 |
| 1983 | 4,184.25 | 2,601.83 | 1,721.67 |
| 1984 | 4,256.65 | 2,745.52 | 1,643.94 |
| 1985 | 4,320.16 | 2,758.10 | 1,695.63 |
| 1986 | 4,539.16 | 2,851.56 | 1,831.17 |
| 1987 | 4,594.10 | 2,783.65 | 1,968.25 |
| 1988 | 4,544.50 | 2,750.27 | 1,961.83 |
| 1989 | 5,110.08 | 3,148.00 | 2,158.09 |
| 1990 | 4,993.44 | 3,037.11 | 2,163.73 |
| 1991 | 5,064.79 | 3,047.24 | 2,237.68 |
| 1992 | 5,250.73 | 3,185.13 | 2,279.61 |
| 1993 | 5,200.87 | 3,115.81 | 2,314.54 |
| 1994 | 5,586.20 | 3,414.30 | 2,413.80 |
| 1995 | 5,726.58 | 3,459.53 | 2,526.65 |
| 1996 | 5,637.18 | 3,385.50 | 2,514.83 |
| 1997 | 5,623.76 | 3,381.87 | 2,513.60 |
| 1998 | 5,296.88 | 3,017.83 | 2,561.01 |
| 1999 | 5,090.74 | 2,818.77 | 2,554.37 |
| 2000 | 5,083.74 | 2,783.89 | 2,590.23 |
| 2001 | 5,560.73 | 3,005.00 | 2,883.61 |
The average cost of Medicare per beneficiary rose from 1973, when disabled Social Security beneficiaries were first eligible for Medicare, until the mid-1990s. In the late 1990s, the average cost of Medicare per beneficiary declined as the cost of Hospital Insurance declined. Cost containment in hospital reimbursements has probably contributed to the reductions in this component of Medicare costs. Hospital Insurance costs began to increase again in 2000, and overall Medicare costs are again rising in real terms. The average cost per beneficiary of Supplementary Medical Insurance has continued to rise through the 1990s, and the increase accelerated between 2000 and 2001.
SSI for the Blind and Disabled
Total cost of payments
The cost to the federal government of the Supplemental Security Income (SSI) disability program has increased nearly 90 percent in real terms (150 percent in nominal terms) since 1990. At the same time, the states' share of SSI has decreased.
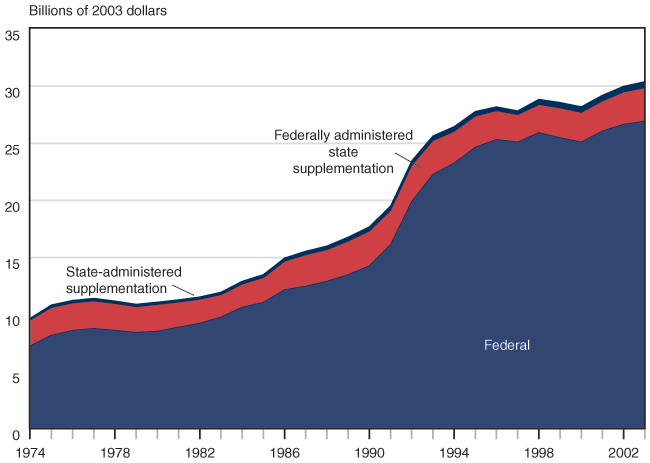
| Year | Federal | Federally administered state supplementation |
State-administered supplementation |
|---|---|---|---|
| 1974 | 7.28 | 2.25 | 0.18 |
| 1975 | 8.20 | 2.42 | 0.25 |
| 1976 | 8.64 | 2.38 | 0.25 |
| 1977 | 8.80 | 2.39 | 0.26 |
| 1978 | 8.64 | 2.33 | 0.24 |
| 1979 | 8.46 | 2.23 | 0.24 |
| 1980 | 8.56 | 2.33 | 0.23 |
| 1981 | 8.92 | 2.17 | 0.22 |
| 1982 | 9.26 | 2.09 | 0.22 |
| 1983 | 9.80 | 1.94 | 0.24 |
| 1984 | 10.66 | 2.01 | 0.27 |
| 1985 | 11.09 | 2.16 | 0.28 |
| 1986 | 12.19 | 2.48 | 0.31 |
| 1987 | 12.50 | 2.74 | 0.33 |
| 1988 | 12.94 | 2.75 | 0.34 |
| 1989 | 13.51 | 2.92 | 0.37 |
| 1990 | 14.29 | 3.03 | 0.39 |
| 1991 | 16.14 | 2.98 | 0.41 |
| 1992 | 19.93 | 3.13 | 0.42 |
| 1993 | 22.28 | 2.95 | 0.43 |
| 1994 | 23.28 | 2.76 | 0.44 |
| 1995 | 24.67 | 2.71 | 0.43 |
| 1996 | 25.35 | 2.50 | 0.36 |
| 1997 | 25.12 | 2.39 | 0.35 |
| 1998 | 25.95 | 2.43 | 0.48 |
| 1999 | 25.49 | 2.61 | 0.49 |
| 2000 | 25.12 | 2.58 | 0.52 |
| 2001 | 26.10 | 2.61 | 0.52 |
| 2002 | 26.67 | 2.82 | 0.52 |
| 2003 | 26.96 | 2.91 | 0.55 |
The cost to the federal government of SSI disability payments has increased nearly 90 percent in real terms (150 percent in nominal terms) since 1990. The states' share of SSI payments has decreased over time, with federal payments now making up nearly 89 percent of the total, up from 75 percent at the program's inception. The federal share peaked in 1997 at slightly more than 90 percent of the cost and has declined slightly since then. The reason for the diminishing role of the state dates back to the birth of the SSI program, when Congress mandated that states maintain, at a minimum, payment expenditures equal to the 1974 level: Congress did not require increases in state funding to make up for changes in the cost of living or in the number of persons participating in the SSI program.2 Although states' expenditures have increased over time, they have not kept pace with increases in the cost of living and the number of recipients.
Number of recipients
Increasing numbers of blind and disabled SSI recipients contribute to the higher cost of the SSI program; however, since the mid-1990s the number of SSI recipients has been relatively constant as a percentage of the population in each age group.
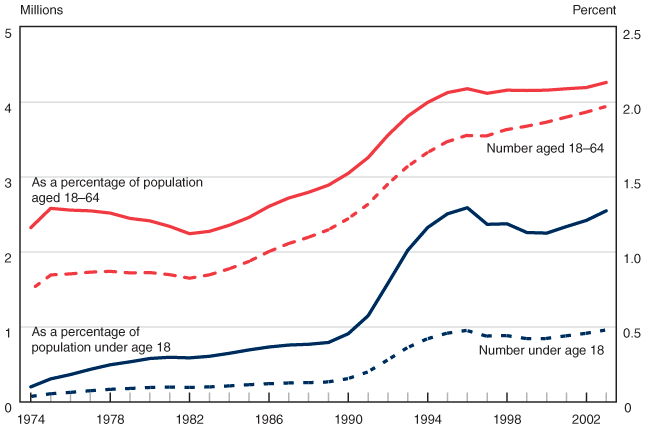
| Year | As a percentage of population |
Number, in millions |
||
|---|---|---|---|---|
| Aged 18–64 |
Under age 18 |
Aged 18–64 |
Under age 18 |
|
| 1974 | 1.16 | 0.10 | 1.50 | 0.07 |
| 1975 | 1.29 | 0.15 | 1.70 | 0.11 |
| 1976 | 1.28 | 0.18 | 1.71 | 0.13 |
| 1977 | 1.27 | 0.22 | 1.74 | 0.15 |
| 1978 | 1.26 | 0.25 | 1.75 | 0.17 |
| 1979 | 1.22 | 0.27 | 1.73 | 0.18 |
| 1980 | 1.21 | 0.29 | 1.73 | 0.19 |
| 1981 | 1.17 | 0.30 | 1.70 | 0.19 |
| 1982 | 1.12 | 0.29 | 1.66 | 0.19 |
| 1983 | 1.14 | 0.30 | 1.70 | 0.20 |
| 1984 | 1.18 | 0.32 | 1.78 | 0.21 |
| 1985 | 1.23 | 0.35 | 1.88 | 0.23 |
| 1986 | 1.30 | 0.37 | 2.01 | 0.24 |
| 1987 | 1.36 | 0.38 | 2.12 | 0.25 |
| 1988 | 1.40 | 0.38 | 2.20 | 0.26 |
| 1989 | 1.45 | 0.40 | 2.30 | 0.26 |
| 1990 | 1.53 | 0.46 | 2.45 | 0.31 |
| 1991 | 1.63 | 0.57 | 2.64 | 0.40 |
| 1992 | 1.78 | 0.79 | 2.91 | 0.56 |
| 1993 | 1.91 | 1.01 | 3.15 | 0.72 |
| 1994 | 2.00 | 1.16 | 3.34 | 0.84 |
| 1995 | 2.06 | 1.26 | 3.48 | 0.92 |
| 1996 | 2.09 | 1.30 | 3.57 | 0.96 |
| 1997 | 2.06 | 1.19 | 3.56 | 0.88 |
| 1998 | 2.08 | 1.19 | 3.65 | 0.89 |
| 1999 | 2.08 | 1.13 | 3.69 | 0.85 |
| 2000 | 2.08 | 1.13 | 3.74 | 0.85 |
| 2001 | 2.09 | 1.17 | 3.81 | 0.88 |
| 2002 | 2.10 | 1.21 | 3.88 | 0.91 |
| 2003 | 2.13 | 1.28 | 3.95 | 0.96 |
The number of blind and disabled SSI recipients has been increasing since the program began, with a few exceptions. The number of SSI disabled children grew dramatically after the Zebley decision in 1990. As the result of this growth, Congress enacted welfare reform legislation in 1996 (Public Law [P.L.] 104-193) that revamped the SSI definition of disability for children, and the program witnessed a small contraction thereafter. Currently, the SSI children's category is growing again, and in 2003 the number of recipients surpassed the 1996 peak. The SSI blind and disabled adult category was affected by legislation in 1996 (P.L. 104-121), which eliminated drug addiction and alcoholism as a basis for receiving benefits. As a result of this legislation, the number of SSI adults aged 18–64 in 1997 decreased slightly. Several pieces of legislation have also limited the access of noncitizens to SSI, which has, for the most part, limited the number of new awards to noncitizens.
Asset limits, which have not changed in two decades, combined with disregards of earned and unearned income that have been unchanged since the program started, may have served to tighten the program's financial eligibility criteria over time. As a percentage of the general population, SSI has been growing very slowly since the mid-1990s, much more slowly than was the case in the 1980s and early 1990s. The slow growth is particularly evident in the 18–64 age group.
Average cost per recipient
Although there were some increases in the average cost per SSI recipient in the early to mid-1990s and some reductions thereafter, the average cost has been fairly stable since 1980.
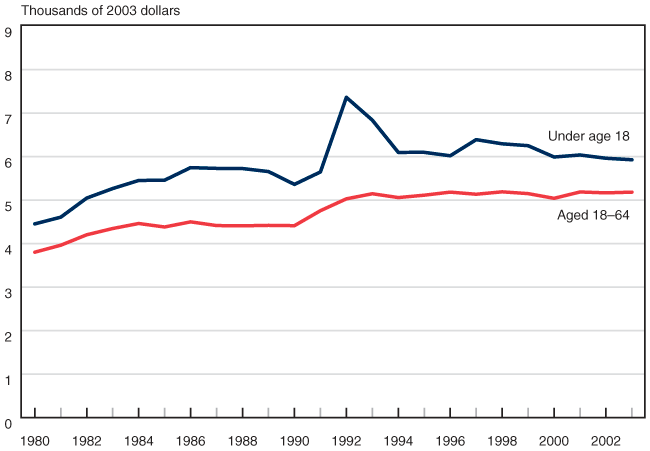
| Year | Aged 18–64 | Under age 18 |
|---|---|---|
| 1980 | 3,802.67 | 4,452.99 |
| 1981 | 3,962.97 | 4,607.59 |
| 1982 | 4,202.66 | 5,046.82 |
| 1983 | 4,346.68 | 5,265.68 |
| 1984 | 4,461.95 | 5,451.22 |
| 1985 | 4,381.54 | 5,457.87 |
| 1986 | 4,499.74 | 5,746.33 |
| 1987 | 4,414.17 | 5,728.72 |
| 1988 | 4,408.45 | 5,724.95 |
| 1989 | 4,419.04 | 5,655.47 |
| 1990 | 4,411.89 | 5,360.83 |
| 1991 | 4,755.92 | 5,646.58 |
| 1992 | 5,028.70 | 7,361.44 |
| 1993 | 5,145.91 | 6,837.36 |
| 1994 | 5,058.13 | 6,096.58 |
| 1995 | 5,112.56 | 6,097.21 |
| 1996 | 5,183.03 | 6,018.41 |
| 1997 | 5,134.50 | 6,389.37 |
| 1998 | 5,189.91 | 6,293.75 |
| 1999 | 5,148.73 | 6,250.60 |
| 2000 | 5,040.77 | 5,990.30 |
| 2001 | 5,186.74 | 6,036.87 |
| 2002 | 5,166.03 | 5,961.39 |
| 2003 | 5,217.73 | 5,953.85 |
The average cost per SSI recipient has remained fairly stable since 1980. It increased slightly in the early to mid-1990s and declined slightly thereafter. This result is not unexpected for a program with a fixed benefit rate that is indexed to inflation. Changes over time are possible because of changes in countable income, backlogs, and retroactive payments, as well as other factors. The large increase in the average annual cost for SSI children in 1992 is probably an anomaly caused by the Zebley court decision. That decision produced a large increase of 40 percent in the number of disabled child recipients in a single year. Retroactive payments for new awards based on the Zebley decision probably resulted in the increased average expenditure that year, which exceeded the full means-tested payment.3
Disabled SSI recipients also receiving Social Security disability benefits
The proportion of SSI recipients aged 18–64 receiving a Social Security disability benefit has remained fairly constant at around 30 percent since 1981. The proportion of SSI recipients receiving disability benefits as a disabled worker increased from 16 percent in 1981 to 21.8 percent in 2003, while the proportion receiving disability benefits as a disabled adult child has declined since the late 1980s.
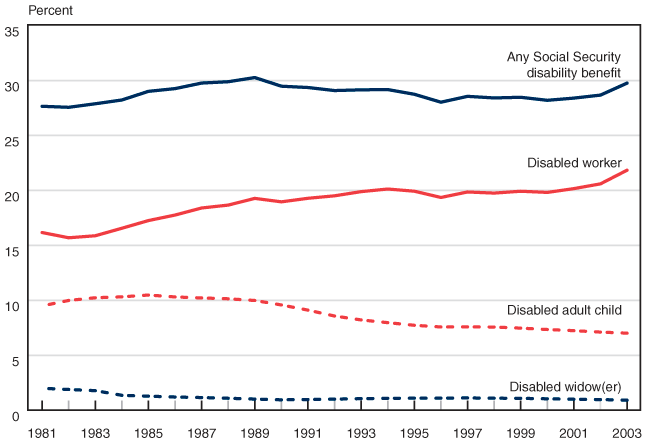
| Year | Any Social Security benefit |
Disabled worker |
Disabled adult child |
Disabled widow(er) |
|---|---|---|---|---|
| 1981 | 27.66 | 16.17 | 9.49 | 0.02 |
| 1982 | 27.57 | 15.69 | 9.99 | 0.02 |
| 1983 | 27.89 | 15.88 | 10.23 | 0.02 |
| 1984 | 28.23 | 16.56 | 10.32 | 0.01 |
| 1985 | 29.02 | 17.26 | 10.48 | 0.01 |
| 1986 | 29.27 | 17.76 | 10.31 | 0.01 |
| 1987 | 29.77 | 18.40 | 10.22 | 0.01 |
| 1988 | 29.89 | 18.67 | 10.14 | 0.01 |
| 1989 | 30.27 | 19.28 | 9.98 | 0.01 |
| 1990 | 29.49 | 18.96 | 9.58 | 0.01 |
| 1991 | 29.37 | 19.29 | 9.11 | 0.01 |
| 1992 | 29.09 | 19.51 | 8.57 | 0.01 |
| 1993 | 29.16 | 19.89 | 8.21 | 0.01 |
| 1994 | 29.18 | 20.13 | 7.97 | 0.01 |
| 1995 | 28.75 | 19.93 | 7.73 | 0.01 |
| 1996 | 28.03 | 19.36 | 7.57 | 0.01 |
| 1997 | 28.56 | 19.86 | 7.58 | 0.01 |
| 1998 | 28.42 | 19.76 | 7.57 | 0.01 |
| 1999 | 28.48 | 19.93 | 7.47 | 0.01 |
| 2000 | 28.20 | 19.82 | 7.34 | 0.01 |
| 2001 | 28.40 | 20.17 | 7.24 | 0.01 |
| 2002 | 28.68 | 20.60 | 7.11 | 0.01 |
| 2003 | 29.77 | 21.84 | 7.01 | 0.01 |
SSI recipients aged 18–64 who are blind or disabled were much more likely to receive disabled-worker benefits under the Disability Insurance program in 2003 (21.8 percent) than they were in 1981 (16 percent). A number of factors may play a role in this increase. It has been suggested that the incentives may have increased for low earners to apply for disability benefits. Changes to SSI work incentives in 1980, most notably sections 1619a and 1619b, may have led to more SSI recipients working and thus earning insured status, which would make them eligible for a worker benefit. The Social Security Administration has been processing a special disability workload in recent years to determine whether SSI recipients might be eligible for a Social Security DI benefit on the basis of their own earnings record.
The proportion of SSI recipients aged 18–64 receiving any Social Security disability benefit—disabled worker, disabled adult child, disabled widow(er)—has remained fairly constant at around 30 percent since 1981. The percentage collecting Social Security DI benefits as disabled adult children has been declining since the late 1980s, and the percentage receiving disabled-widow(er) benefits declined slightly in the early 1980s and has remained at about 1 percent of SSI recipients since then.
Medicaid for the Disabled
Total cost of payments
Medicaid payments for the disabled have increased greatly in real terms since fiscal year 1975. Between 1990 and 2001, Medicaid payments for the disabled grew nearly 150 percent in real terms, the highest growth rate in costs among the programs under study.
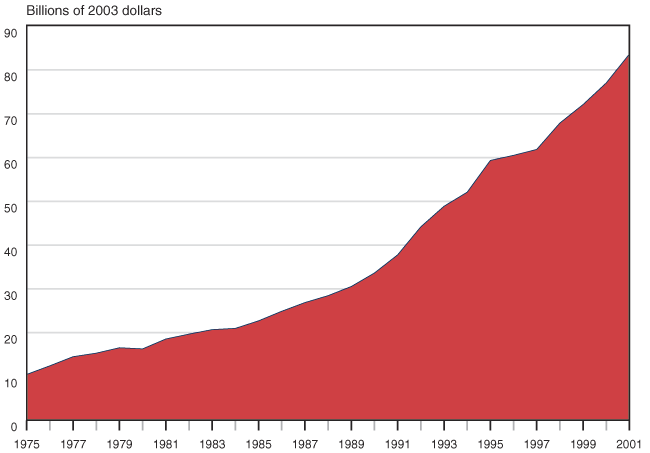
| Year | Cost (billions of 2003 dllars) |
|---|---|
| 1975 | 10.44 |
| 1976 | 12.41 |
| 1977 | 14.49 |
| 1978 | 15.30 |
| 1979 | 16.54 |
| 1980 | 16.28 |
| 1981 | 18.54 |
| 1982 | 19.65 |
| 1983 | 20.68 |
| 1984 | 20.96 |
| 1985 | 22.68 |
| 1986 | 24.87 |
| 1987 | 26.86 |
| 1988 | 28.44 |
| 1989 | 30.52 |
| 1990 | 33.61 |
| 1991 | 37.76 |
| 1992 | 44.16 |
| 1993 | 48.86 |
| 1994 | 52.07 |
| 1995 | 59.33 |
| 1996 | 60.50 |
| 1997 | 61.85 |
| 1998 | 67.89 |
| 1999 | 72.11 |
| 2000 | 77.05 |
| 2001 | 83.65 |
Medicaid benefits are available to the vast majority of disabled SSI recipients, supplementing Medicare benefits for SSI recipients who also receive Social Security disability benefits and have been through the 24-month waiting period. Medicaid is also available to other categories of disabled persons, in some cases with a buy-in for coverage.
Medicaid payments for the disabled have increased greatly in real terms since 1975. Between 1990 and 2001, they rose nearly 150 percent in real terms, the highest growth rate in costs among the programs under study. Costs associated with covering Qualified Medicare Beneficiaries (under a program established in 1988) and Specified Low-income Medicare Beneficiaries (a program that dates to 1990) contribute to the overall rise in payments.
Number of recipients
The number of disabled Medicaid recipients nearly tripled between fiscal years 1975 and 2001 and increased 90 percent between 1990 and 2001. Part of the increase is due to new Medicaid programs for the disabled, such as buy-ins.
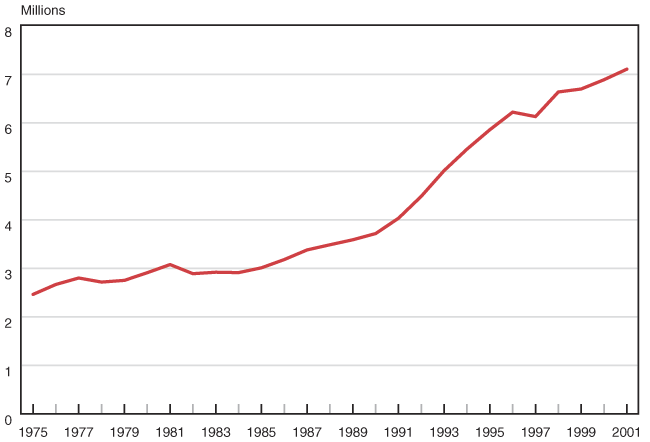
| Year | Number (millions) |
|---|---|
| 1975 | 2.46 |
| 1976 | 2.67 |
| 1977 | 2.80 |
| 1978 | 2.72 |
| 1979 | 2.75 |
| 1980 | 2.91 |
| 1981 | 3.08 |
| 1982 | 2.89 |
| 1983 | 2.92 |
| 1984 | 2.91 |
| 1985 | 3.01 |
| 1986 | 3.18 |
| 1987 | 3.38 |
| 1988 | 3.49 |
| 1989 | 3.59 |
| 1990 | 3.72 |
| 1991 | 4.03 |
| 1992 | 4.49 |
| 1993 | 5.02 |
| 1994 | 5.46 |
| 1995 | 5.86 |
| 1996 | 6.22 |
| 1997 | 6.13 |
| 1998 | 6.64 |
| 1999 | 6.70 |
| 2000 | 6.89 |
| 2001 | 7.11 |
The number of disabled Medicaid recipients nearly tripled between 1975 and 2001 and increased 90 percent between 1990 and 2001. This number includes not only most SSI recipients but also other qualified disabled persons. Although some of this increase is due to growth in the number of disabled individuals in the general population and the number of SSI recipients, some of the increase is due to expansions in the Medicaid program since the late 1980s. Congress enacted several changes to the Medicaid program that increased the number of disabled persons eligible for the program. The numbers above include disabled Medicare beneficiaries who are Qualified Medicare Beneficiaries (covered under a program established in 1988) and Specified Low-income Medicare Beneficiaries (since 1990). Another legislated expansion for the disabled involved provisions for states to establish buy-in programs, through which a disabled individual who was working or had relatively high income or resources, and who would not normally qualify for Medicaid, could pay a premium to buy Medicaid coverage. States may subsidize the buy-in premium for persons with low income. These optional buy-in programs were permitted by Congress in 1997 and expanded in 1999. Many states do not have buy-in programs, and the number of participants is small in states with programs.
Average cost per recipient
Average cost of Medicaid payments for the disabled nearly tripled (an increase of 177 percent) between 1975 and 2001 and increased 30 percent in real terms from 1990 to 2001. Costs per disabled recipient exceeded $11,000 in 2001.
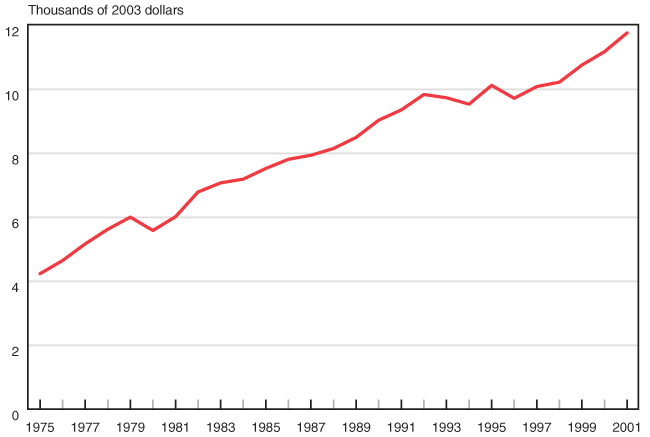
| Year | 2003 dollars |
|---|---|
| 1975 | 4,238.50 |
| 1976 | 4,650.93 |
| 1977 | 5,171.93 |
| 1978 | 5,628.90 |
| 1979 | 6,006.73 |
| 1980 | 5,590.93 |
| 1981 | 6,020.73 |
| 1982 | 6,796.25 |
| 1983 | 7,079.95 |
| 1984 | 7,196.22 |
| 1985 | 7,530.73 |
| 1986 | 7,816.78 |
| 1987 | 7,943.70 |
| 1988 | 8,155.66 |
| 1989 | 8,502.57 |
| 1990 | 9,041.09 |
| 1991 | 9,361.96 |
| 1992 | 9,842.76 |
| 1993 | 9,741.28 |
| 1994 | 9,540.91 |
| 1995 | 10,128.68 |
| 1996 | 9,725.41 |
| 1997 | 10,091.12 |
| 1998 | 10,228.80 |
| 1999 | 10,765.94 |
| 2000 | 11,184.21 |
| 2001 | 11,770.45 |
The average cost of Medicaid per recipient has been increasing over time, indicating that the increase in the number of Medicaid recipients does not fully account for the increased cost of the Medicaid program. From 1975 to 2001, the cost per disabled recipient increased 177 percent in real terms, compared with a rise of 143 percent in Medicare over the same period. The cost of Medicaid per recipient in real terms increased at a slower rate over the period 1990 to 2001, increasing only 30 percent, while the total cost of Medicaid increased 150 percent during the same period. The 90 percent increase in the number of Medicaid recipients between 1990 and 2001 was the greater contributor to the increase in Medicaid cost over that period. In the most recent years, the increase in average Medicaid costs has accelerated. The impact of the Qualified Medicare Beneficiary and Specified Low-income Medicare Beneficiary programs on average costs is unclear, although one might expect the expense associated with cost sharing and Part B premiums, respectively, to be less than the cost of providing full Medicaid coverage for the disabled, thus holding down the increase in average costs.
Benefit Costs as a Percentage of GDP
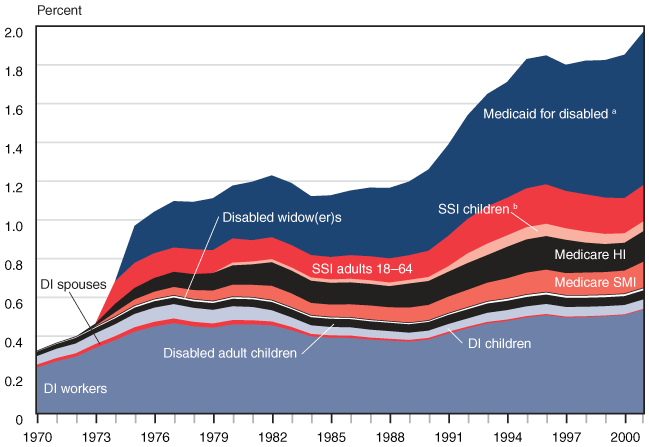
The cost of benefits for the disability programs as a portion of gross domestic product (GDP) rose dramatically during the 1990s, increasing from 1.26 percent of GDP in 1990 to nearly 2 percent in 2001.
| Year | Medicaid for disabled a |
SSI adults 18–64 |
SSI children b |
Medicare HI |
Medicare SMI |
Disabled widow(er)s |
Disabled adult children |
DI children |
DI spouses |
DI workers |
|---|---|---|---|---|---|---|---|---|---|---|
| 1970 | 0 | 0 | 0 | 0 | 0 | 0 | 0.02 | 0.04 | 0.02 | 0.24 |
| 1971 | 0 | 0 | 0 | 0 | 0 | 0.01 | 0.02 | 0.05 | 0.02 | 0.27 |
| 1972 | 0 | 0 | 0 | 0 | 0 | 0.01 | 0.03 | 0.05 | 0.02 | 0.29 |
| 1973 | 0 | 0 | 0 | 0.01 | 0 | 0.01 | 0.03 | 0.05 | 0.02 | 0.34 |
| 1974 | 0 | 0.12 | 0 | 0.04 | 0.02 | 0.01 | 0.03 | 0.06 | 0.02 | 0.38 |
| 1975 | 0.19 | 0.13 | 0 | 0.06 | 0.03 | 0.01 | 0.03 | 0.07 | 0.02 | 0.42 |
| 1976 | 0.21 | 0.13 | 0 | 0.07 | 0.04 | 0.01 | 0.03 | 0.07 | 0.02 | 0.45 |
| 1977 | 0.24 | 0.12 | 0 | 0.08 | 0.04 | 0.01 | 0.03 | 0.07 | 0.02 | 0.47 |
| 1978 | 0.24 | 0.13 | 0 | 0.08 | 0.05 | 0.01 | 0.03 | 0.07 | 0.02 | 0.45 |
| 1979 | 0.27 | 0.12 | 0 | 0.09 | 0.05 | 0.01 | 0.03 | 0.07 | 0.02 | 0.44 |
| 1980 | 0.27 | 0.12 | 0.01 | 0.10 | 0.06 | 0.01 | 0.04 | 0.07 | 0.02 | 0.46 |
| 1981 | 0.30 | 0.11 | 0.01 | 0.11 | 0.06 | 0.01 | 0.04 | 0.07 | 0.02 | 0.46 |
| 1982 | 0.32 | 0.11 | 0.02 | 0.12 | 0.07 | 0.01 | 0.04 | 0.06 | 0.02 | 0.46 |
| 1983 | 0.32 | 0.11 | 0.02 | 0.12 | 0.07 | 0.01 | 0.04 | 0.05 | 0.02 | 0.43 |
| 1984 | 0.30 | 0.12 | 0.02 | 0.12 | 0.06 | 0.01 | 0.04 | 0.04 | 0.01 | 0.40 |
| 1985 | 0.32 | 0.12 | 0.02 | 0.11 | 0.06 | 0.01 | 0.04 | 0.04 | 0.01 | 0.39 |
| 1986 | 0.33 | 0.12 | 0.02 | 0.11 | 0.07 | 0.01 | 0.04 | 0.04 | 0.01 | 0.39 |
| 1987 | 0.35 | 0.12 | 0.02 | 0.11 | 0.07 | 0.01 | 0.04 | 0.04 | 0.01 | 0.38 |
| 1988 | 0.36 | 0.12 | 0.02 | 0.11 | 0.07 | 0.01 | 0.04 | 0.04 | 0.01 | 0.38 |
| 1989 | 0.38 | 0.13 | 0.02 | 0.12 | 0.08 | 0.01 | 0.04 | 0.04 | 0.01 | 0.37 |
| 1990 | 0.42 | 0.14 | 0.02 | 0.12 | 0.08 | 0.01 | 0.04 | 0.04 | 0.01 | 0.38 |
| 1991 | 0.47 | 0.16 | 0.03 | 0.13 | 0.09 | 0.01 | 0.05 | 0.04 | 0.01 | 0.41 |
| 1992 | 0.54 | 0.18 | 0.05 | 0.14 | 0.09 | 0.01 | 0.05 | 0.04 | 0.01 | 0.44 |
| 1993 | 0.58 | 0.19 | 0.06 | 0.14 | 0.10 | 0.01 | 0.05 | 0.05 | 0.01 | 0.46 |
| 1994 | 0.60 | 0.19 | 0.06 | 0.16 | 0.10 | 0.01 | 0.05 | 0.05 | 0.01 | 0.48 |
| 1995 | 0.67 | 0.20 | 0.06 | 0.17 | 0.11 | 0.01 | 0.05 | 0.05 | 0.01 | 0.49 |
| 1996 | 0.67 | 0.20 | 0.06 | 0.17 | 0.12 | 0.01 | 0.05 | 0.05 | 0.01 | 0.51 |
| 1997 | 0.65 | 0.19 | 0.06 | 0.17 | 0.11 | 0.01 | 0.05 | 0.05 | 0.01 | 0.49 |
| 1998 | 0.69 | 0.19 | 0.06 | 0.15 | 0.12 | 0.01 | 0.05 | 0.05 | 0.01 | 0.50 |
| 1999 | 0.71 | 0.19 | 0.05 | 0.14 | 0.12 | 0.01 | 0.05 | 0.05 | 0 | 0.50 |
| 2000 | 0.74 | 0.18 | 0.05 | 0.14 | 0.12 | 0.01 | 0.05 | 0.05 | 0 | 0.51 |
| 2001 | 0.79 | 0.19 | 0.05 | 0.16 | 0.14 | 0.01 | 0.05 | 0.05 | 0 | 0.54 |
Although earlier charts showed that benefit costs have increased dramatically, nearly doubling in real terms since 1990, it is important to view these benefits relative to the size of the economy. Chart 17 presents the major disability programs as a percentage of gross domestic product. Expenditures on cash and medical benefits for the disabled, as a percentage of GDP, increased 57 percent between 1990 and 2001, consuming 1.98 percent of GDP in 2001, up from 1.26 percent in 1990.
Although many of the expenditures have increased over time, the most dramatic growth is seen in Medicaid expenditures for the disabled. As shown earlier, Medicaid costs have increased because of a tripling of the number of disabled individuals receiving Medicaid since 1975 and a 175 percent increase in the average cost of Medicaid benefits during the same period.
Before implementation of SSI in 1974, the Aid to the Permanently and Totally Disabled and Aid to the Blind programs addressed the needs of the low-income population. These state-administered programs are not included in the chart for the period 1970–1974, so costs during that period are understated. Both programs were considerably smaller and less expensive than is SSI. In 1972, the two programs paid $1.4 billion in cash payments to 1.2 million recipients. After SSI was fully implemented in 1975, 1.9 million disabled recipients were receiving $3.3 billion in SSI payments.
International Expenditures on Disability Programs
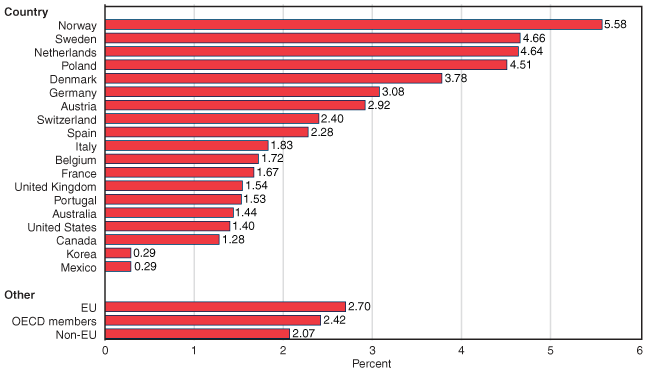
As a percentage of gross domestic product (GDP), the costs of disability programs in the United States are considerably smaller than those of most other countries.
| Percent | |
|---|---|
| Country | 5.58 |
| Norway | 4.66 |
| Sweden | 4.64 |
| Netherlands | 4.51 |
| Poland | 3.78 |
| Denmark | 3.08 |
| Germany | 2.92 |
| Austria | 2.40 |
| Switzerland | 2.28 |
| Spain | 1.83 |
| Italy | 1.72 |
| Belgium | 1.67 |
| France | 1.54 |
| United Kingdom | 1.53 |
| Portugal | 1.44 |
| Australia | 1.40 |
| United States | 1.28 |
| Canada | 0.29 |
| Korea | 0.29 |
| Mexico | |
| Other | |
| European Union | 2.70 |
| OECD members | 2.42 |
| Non European Union | 2.07 |
It is interesting to compare the level of benefit costs for disability programs in the United States with those in other countries. The Organisation for Economic Co-operation and Development (OECD) recently released a report comparing the costs of disability programs across countries, from which international data in this book are drawn. The data show the percentage of GDP that is expended on all disability-related programs in each of the countries. Analyzing the OECD figures shows that the United States spent a lower percentage of its GDP on disability programs than did all other countries under study except Canada, Korea, and Mexico.4 Norway, Sweden, and the Netherlands spent three times as much on their disability programs as did the United States.
There are many reasons why the cost of the disability programs is lower in the United States. The definition of disability is very strict in the United States, which includes only persons who are unable to work for extended periods, whereas many countries offer temporary and partial disability benefits. Moreover, many European countries have more generous disability benefits than does the United States, and some countries have used the disability programs as early retirement programs, particularly when economic conditions are poor.
Disability Programs and Self-Reported Disability
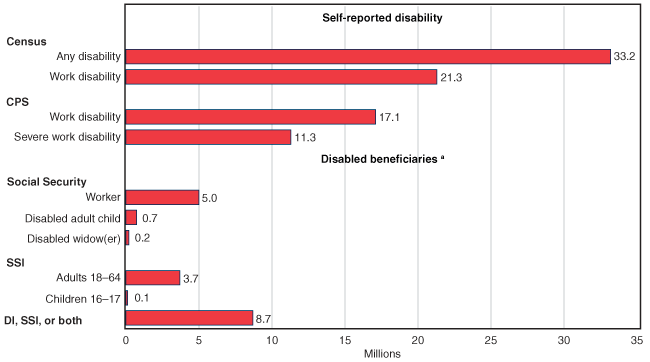
The disability programs serve only a portion of the population self-reporting a disability. Although fewer than 9 million disabled persons received benefits from Social Security disability, SSI disability, or both in 2000, estimates of the disabled population vary between 11 million and 33 million, depending on the definition of disability.
| Disability program | Disability population (millions) |
|---|---|
| Self-reported disability | |
| Census | |
| Any disability | 33.2 |
| Work disability | 21.3 |
| CPS | |
| Work disability | 17.1 |
| Severe work disability | 11.3 |
| Disabled beneficiaries a | |
| Social Security | |
| Worker | 5.0 |
| Disabled adult child | 0.7 |
| Disabled widow(er) | 0.2 |
| SSI | |
| Adults 18–64 | 3.7 |
| Children 16–17 | 0.1 |
| DI, SSI, or both | 8.7 |
The disability programs served 8.7 million disabled persons aged 16–64 in 2000. The population self-reporting a disability ranged between 11 million and 33 million persons, depending on the definition and the survey.5 Using the definition yielding the smallest estimate of the disabled population—the definition of severe work disability in the Current Population Survey (CPS)—nearly a quarter of these persons were not on the disability rolls.6 This suggests that there may be additional potential for increases in the number of disability beneficiaries in the future. Estimates based on other, less stringent definitions of disability suggest that programs directed at temporary or partial disability could attract a large number of potential beneficiaries.
International Prevalence of Disability
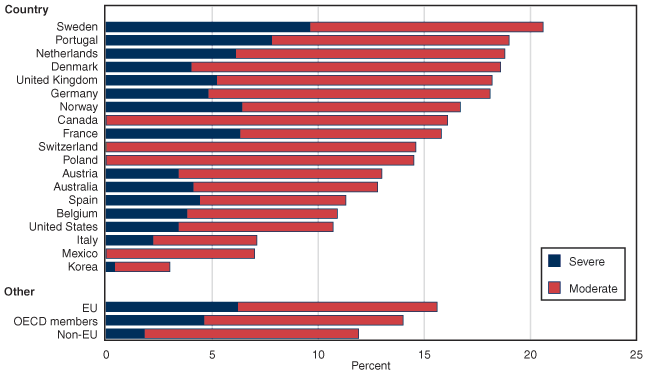
The overall prevalence of disability in the United States is relatively low compared with prevalence in other countries. The prevalence of severe disability is also lower in the United States than it is in many other countries, although the differences in rates of severe disability across countries do not seem as large as the differences in overall prevalence rates.
| Severity | Severe | Moderate | Total |
|---|---|---|---|
| Country | |||
| Sweden | 9.6 | 11.0 | 20.6 |
| Portugal | 7.8 | 11.2 | 19.0 |
| Netherlands | 6.1 | 12.7 | 18.8 |
| Denmark | 4.0 | 14.6 | 18.6 |
| United Kingdom | 5.2 | 13.0 | 18.2 |
| Germany | 4.8 | 13.3 | 18.1 |
| Norway | 6.4 | 10.3 | 16.7 |
| Canada | a | a | 16.1 |
| France | 6.3 | 9.5 | 15.8 |
| Switzerland | a | a | 14.6 |
| Poland | a | a | 14.5 |
| Austria | 3.4 | 9.6 | 13.0 |
| Australia | 4.1 | 8.7 | 12.8 |
| Spain | 4.4 | 6.9 | 11.3 |
| Belgium | 3.8 | 7.1 | 10.9 |
| United States | 3.4 | 7.3 | 10.7 |
| Italy | 2.2 | 4.9 | 7.1 |
| Mexico | a | a | 7.0 |
| Korea | 0.4 | 2.6 | 3.0 |
| Other | |||
| European Union | 6.2 | 9.4 | 15.6 |
| OECD members | 4.6 | 9.4 | 14.0 |
| Non European Union | 1.8 | 10.1 | 11.9 |
The overall prevalence of disability in the United States is relatively low compared with that in other countries, exceeding the prevalence in only Italy, Mexico, and Korea. The prevalence of severe disability is also lower in the United States than it is in many other countries, although the differences in rates of severe disability across countries do not seem as large as the differences in overall prevalence rates. Persons with a severe disability make up a greater portion of the disabled in the United States than they do in some of the countries with high disability prevalence rates (for example, Denmark and Germany). On the one hand, the lower rates of disability in the United States could suggest that the U.S. disability programs may be less at risk than are programs in other countries. On the other hand, if the prevalence of disability in the U.S. population were to begin to mirror that of other countries, U.S. disability programs could experience more growth in the future. The attractiveness of disability programs in some countries (for example, those in northern Europe) may actually influence the perception of disability and increase the number of people reporting disabilities or severe disabilities.
Notes
1. Social Security disability includes benefits paid from the DI trust fund to disabled workers and their dependents, as well as benefits paid from the OASI trust fund to disabled widow(er)s and some disabled adult children.
2. For a description and history of the SSI program, see the section on Program Descriptions and Legislative History of the Annual Statistical Supplement to the Social Security Bulletin. A specific discussion of state supplementation of SSI payments can be found under the heading "SSI: History of Provisions."
3. A large influx of awards (without retroactive payments) could be expected to reduce average cost because, on average, the new awards will collect only 6 months of benefits rather than 12 months for other beneficiaries, thus increasing the denominator (beneficiaries) more than the numerator (total payments). An influx of persons with large retroactive payments could alter this expectation and serve to increase the average annual cost.
4. OECD figures differ somewhat from those generated from SSA administrative data; however, the OECD approach is consistent across countries, and relative magnitudes should be correct.
5. The variability from one source to another in estimates of the percentage of the general population that reports being disabled is evident in the chart above. The Decennial Census of 2000 and the Current Population Survey collected data using a definition of work disability in 2000, yet one estimate was 25 percent higher than the other: 21.3 million vs. 17.1 million, respectively.
6. The Current Population Survey is a monthly survey conducted by the Census Bureau for the Bureau of Labor Statistics in the Department of Labor. The survey has been conducted for more than 50 years. Data on disability in the CPS come from the March Supplement to the survey. Additional CPS data on disability are provided in Chart 46.