2013 OASDI Trustees Report

skip to main content
Table of Contents Previous Next Tables Figures Index

C. PROGRAM-SPECIFIC ASSUMPTIONS AND METHODS
The Office of the Chief Actuary at the Social Security Administration uses a set of models to project future income and cost under the OASDI program. These models rely not only on the demographic and economic assumptions described in the previous sections, but also on a number of program-specific assumptions and methods. Values of many program parameters change from year to year as prescribed by formulas set out in the Social Security Act. These program parameters affect the level of payroll taxes collected and the level of benefits paid. The office uses more complex models to project the numbers of future workers covered under OASDI and the levels of their covered earnings, as well as the numbers of future beneficiaries and the expected levels of their benefits. The following subsections provide descriptions of these program-specific assumptions and methods.
1. Automatically Adjusted Program Parameters
The Social Security Act requires that certain parameters affecting the determination of OASDI benefits and taxes be adjusted annually to reflect changes in particular economic measures. Formulas prescribed in the law, applied to reported statistics, change these program parameters annually. The law bases these automatic adjustments on measured changes in the national average wage index (AWI) and the Consumer Price Index for Urban Wage Earners and Clerical Workers (CPI).1 This section shows values for program parameters adjusted using these indices from the time that these adjustments became effective through 2022. Projected values for future years depend on the economic assumptions described in the preceding section of this report.
Tables V.C1 and V.C2 present the historical and projected values of the CPI-based benefit increases, the AWI series, and the values of many of the wage-indexed program parameters. Each table shows projections under the three alternative sets of economic assumptions. Table V.C1 includes:
The annual cost-of-living benefit increase percentages. The automatic cost-of-living adjustment provisions in the Social Security Act specify increases in OASDI benefits based on increases in the CPI. In December 2009 and December 2010, there were no cost-of-living adjustments. Cost-of-living adjustments resumed in December 2011. Under all three sets of economic assumptions, the Trustees assume a smooth trend in future price increases, without regard to annual fluctuations that will occur. Therefore, the projections include annual cost-of-living adjustments in all future years.
The annual levels of and percentage increases in the AWI. Under section 215(b)(3) of the Social Security Act, Social Security benefit computations index taxable earnings (for most workers first becoming eligible for benefits in 1979 or later) using the AWI for each year after 1950. This procedure converts a worker’s past earnings to approximately average-wage-indexed equivalent values near the time of his or her benefit eligibility. Other program parameters presented in this section that are subject to the automatic-adjustment provisions also rely on the AWI.
The wage-indexed contribution and benefit base. For any year, the contribution and benefit base is the maximum amount of earnings subject to the OASDI payroll tax and creditable toward benefit computation. The Social Security Act defers any increase in the contribution and benefit base if there is no cost-of-living adjustment effective for December of the preceding year. There was no increase in the contribution and benefit base in 2010 and 2011. Increases resumed in 2012.
The wage-indexed retirement earnings test exempt amounts. The exempt amounts are the annual amount of earnings below which beneficiaries do not have benefits withheld. A lower exempt amount applies in years before normal retirement age. A higher amount applies for the year in which a beneficiary attains normal retirement age. Starting in 2000, the retirement earnings test no longer applies beginning with the month of normal retirement age attainment. The Social Security Act defers any increase in these exempt amounts if there is no cost-of-living adjustment effective for December of the preceding year. There was no increase in these exempt amounts in 2010 and 2011. Increases resumed in 2012.
 
Cost-of-living
benefit
increasea
(percent)
Average
wage index (AWI)  b

Contribution
and benefit
base c
Under
NRAd
At NRAe
f 2.5
g1.7
g 110,100
g  14,640
g 38,880
g113,700
g15,120
g40,080
g1.7
g110,100
g  14,640
g 38,880
g113,700
g15,120
g40,080
g1.7
g110,100
g  14,640
g 38,880
g113,700
g15,120
g40,080

a
Effective with benefits payable for June in each year 1975-82, and for December in each year after 1982.

b
See table VI.F6 for projected dollar amounts of the AWI beyond 2022.

c
Public Law 95-216 specified amounts for 1978-81. Public Law 101-239 changed the indexing procedure and caused slightly higher bases after 1989.

d
Normal retirement age. See table V.C3 for specific values.

e
In 1955-82, the retirement earnings test did not apply at ages 72 and over. In 1983-99, the test did not apply at ages 70 and over. Beginning in 2000, the test does not apply beginning with the month of normal retirement age attainment. In the year of normal retirement age attainment, the higher exempt amount applies to earnings prior to the month of normal retirement age attainment. Public Law 95-216 specified amounts for 1978-82. Public Law 104‑121 specified amounts for 1996-2002.

f
Originally determined as 2.4 percent. Pursuant to Public Law 106-554, effectively 2.5 percent.

g
Actual amount, as determined under automatic-adjustment provisions.

Table V.C2 shows values for other wage-indexed parameters. The table provides historical values from 1978, when indexing of the amount of earnings required for a quarter of coverage first began, through 2013, and also shows projected values through 2022. These other wage-indexed program parameters are:
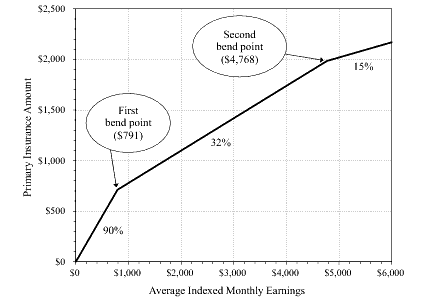
The bend points in the formula for computing the primary insurance amount (PIA) for workers who reach age 62, become disabled, or die in a given year. As figure V.C1 illustrates, these two bend points define three ranges in a worker’s average indexed monthly earnings (AIME). The formula for the worker’s PIA multiplies a 90, 32, or 15 percent factor by the portion of the worker’s AIME that falls within the three respective ranges, and then adds the resulting products together.
 
The bend points in the formula for computing the maximum total amount of monthly benefits payable based on the earnings record of a retired or deceased worker (maximum family benefit). As figure V.C2 illustrates, these three bend points define four ranges in a worker’s PIA. The formula for the maximum family benefit multiplies a 150, 272, 134, or 175 percent factor by the portion of the worker’s PIA that falls within the four respective ranges, and then adds the resulting products together.
 
The amount of earnings required in a year to earn a quarter of coverage (QC). The number and timing of QCs earned determines an individual’s insured status — the basic requirement for benefit eligibility under OASDI.
The old-law contribution and benefit base—the contribution and benefit base that would have been in effect without enactment of the 1977 amendments. This old-law base is used in determining special-minimum benefits for certain workers who have many years of low earnings in covered employment. Since 1986, the calculation of OASDI benefits for certain workers who are eligible to receive pensions based on noncovered employment uses the old-law base. In addition, the Railroad Retirement program and the Employee Retirement Income Security Act of 1974 use the old-law base for certain purposes.
 
AIME bend
points in PIA
formula a
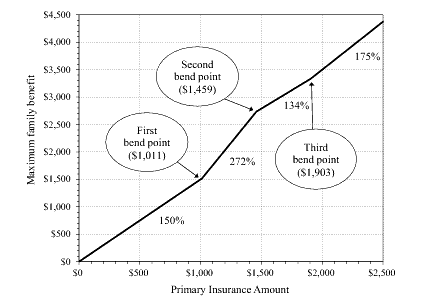
PIA bend points
in maximum-
family-benefit formula b
Old-law
contribution
and benefit base c
d
d
d
d
$250e
$17,700e
e $180
e $1,085
e $230
e $332
e $433

a
The formula to compute a PIA is: (1) 90% of AIME below the first bend point; plus (2) 32% of AIME in excess of the first bend point but not in excess of the second; plus (3) 15% of AIME in excess of the second bend point. The bend points are determined based on the first year a beneficiary becomes eligible for benefits.

b
The formula to compute a family maximum is: (1) 150% of PIA below the first bend point; plus (2) 272% of PIA in excess of the first bend point but not in excess of the second; plus (3) 134% of PIA in excess of the second bend point but not in excess of the third; plus (4) 175% of PIA in excess of the third bend point.

c
Contribution and benefit base that would have been in effect without enactment of the Social Security Amendments of 1977. Public Law 101-239 changed the indexing procedure and caused slightly higher bases after 1989.

d
No provision in law for this amount in this year.

e
Amount specified by Social Security Amendments of 1977.

In addition to the economic factors that affect the determination of OASDI benefits, there are certain legislated changes that affect current and future benefit amounts. Two such changes are the scheduled increases in the normal retirement age and in the delayed retirement credits. Table V.C3 shows the scheduled changes in these parameters and the resulting effects on benefit levels expressed as a percentage of PIA.
 
3 1/2
103 1/2
117 1/2
3 1/2
103 1/2
117 1/2
4 1/2
104 1/2
122 1/2
4 1/2
104 1/2
122 1/2
5 1/2
105 1/2
127 1/2
5 1/2
105 1/2
127 1/2
6 1/2
106 1/2
132 1/2
6 1/2
79 1/6
98 8/9
105 5/12
111 11/12
131 5/12
78 1/3
97 7/9
104 2/3
111 2/3
132 2/3
77 1/2
96 2/3
103 1/2
110 1/2
131 1/2
7 1/2
76 2/3
95 5/9
102 1/2
132 1/2
7 1/2
75 5/6
94 4/9
101 1/4
108 3/4
131 1/4
93 1/3
74 1/6
92 2/9
98 8/9
106 2/3
130 2/3
73 1/3
91 1/9
97 7/9
105 1/3
129 1/3
72 1/2
96 2/3
71 2/3
88 8/9
95 5/9
102 2/3
126 2/3
70 5/6
87 7/9
94 4/9
101 1/3
125 1/3
86 2/3
93 1/3
2. Covered Employment
Projections of the total U.S. labor force and unemployment rate (see table V.B2) are based on Bureau of Labor Statistics definitions from the Current Population Survey (CPS). These projections represent the average weekly number of employed and unemployed persons, age 16 and over, in the U.S. in a calendar year. The Office of the Chief Actuary defines the total covered workers in a year as the persons who have any OASDI covered earnings (that is, earnings subject to the OASDI payroll tax) at any time during the year. For those age 16 and over, projected covered employment is the sum of age-sex components, each reflecting the growth projected for the component’s total U.S employment and average weeks worked per year.2For the short-range period, the average weeks worked for each component is assumed to increase during the economic recovery. After 2022, the average weeks worked for each component is assumed to remain constant. The projection method also accounts for changes in non-OASDI-covered employment, the increase in coverage of Federal civilian employment as a result of the 1983 Social Security Amendments, and changes in the number and employment status of other immigrants residing within the Social Security coverage area.
The covered-worker rate is the ratio of OASDI covered workers to the Social Security area population. For men age 16 and over, the projected age-adjusted covered-worker rates3 for 2087 are 71.2, 70.5, and 69.8 percent for the low-cost, intermediate, and high-cost assumptions, respectively. For women age 16 and over, the projected covered-worker rates for 2087 are 65.2, 64.5, and 63.7 percent for the low-cost, intermediate, and high-cost assumptions, respectively. These rates are higher than the 2011 levels of 66.8 percent for males and 59.9 percent for women, due to the assumed decreases in unemployment rates and assumed increase in labor force participation rates.
3. Insured Population
Eligibility for worker benefits under the OASDI program requires some threshold level of work in covered employment. A worker satisfies this requirement by his or her accumulation of quarters of coverage (QCs). Prior to 1978, a worker earned one QC for each calendar quarter in which he or she earned at least $50. In 1978, when annual earnings reporting replaced quarterly reporting, the amount required to earn a QC (up to a maximum of four per year) was set at $250. As specified in the law, the Social Security Administration has adjusted this amount each year since then according to changes in the AWI. Its value in 2013 is $1,160.
There are three types of insured status that a worker can acquire under the OASDI program. The number and recency of QCs earned determine each status. A worker acquires fully insured status when his or her total number of QCs is greater than or equal to the number of years elapsed after the year of attainment of age 21 (but not less than six). Once a worker has accumulated 40 QCs, he or she remains permanently fully insured. A worker acquires disability insured status if he or she is: (1) a fully insured worker who has accumulated 20 QCs during the 40-quarter period ending with the current quarter; (2) a fully insured worker aged 24-30 who has accumulated QCs during one-half of the quarters elapsed after the quarter of attainment of age 21 and up to and including the current quarter; or (3) a fully insured worker under age 24 who has accumulated six QCs during the 12-quarter period ending with the current quarter. A worker acquires currently insured status when he or she has accumulated six QCs during the 13-quarter period ending with the current quarter. Periods of disability reduce the number of quarters required for insured status, but not below the minimum of six QCs.
There are many types of benefits payable to workers and their family members under the OASDI program. A worker must be fully insured to be eligible for a primary retirement benefit and for his or her spouse or children to be eligible for auxiliary benefits. A deceased worker must have been either currently insured or fully insured at the time of death for his or her children (and their mother or father) to be eligible for benefits. If there are no eligible surviving children, the deceased worker must have been fully insured at the time of death for his or her surviving spouse to be eligible. A worker must be disability insured to be eligible for a primary disability benefit and for his or her spouse or children to be eligible for auxiliary benefits.
The Office of the Chief Actuary estimates the fully insured population, as a percentage of the Social Security area population, by single year of age and sex starting in 1969. The short-range model extrapolates the historical trend in these rates from data in the Continuous Work History Sample. The model uses information on quarters of coverage earned due to employment covered by Social Security derived from tabulations of the Continuous Work History Sample. The model also uses historical administrative data on beneficiaries in force and estimated historical mortality rates. The model combines this information to estimate the proportion of individuals who were alive and fully insured as of the end of each historical year. Using projected mortality rates and covered workers, the model extrapolates these rates into the future and applies them to the historical and projected population to arrive at the fully insured population by age and sex through the end of the short-range period.
The long-range fully insured model uses 30,000 simulated work histories for each sex and birth cohort, representing everyone except the other immigrant population. For the other immigrant population, the model generates substantially lower percentages attaining fully insured status. The model constructs simulated work histories using past coverage rates, earnings distributions, and amounts required for crediting QCs, and develops them in a manner that replicates historical individual variations in work patterns. The probability of covered employment in any year is assumed to be higher for those who have worked more consistently in the recent past. Model parameters are selected so that simulated fully insured percentages are consistent with the fully insured percentages estimated by the short-range model for the recent historical period.
The Office of the Chief Actuary estimates the disability insured population, as a percentage of the fully insured population, by age and sex starting in 1970. The office bases historical values on a tabulation of the disability insured population from the Continuous Work History Sample and estimates of the fully insured population. The short-range model projects these percentages by using the relationship between the historical percentages and covered worker rates. The long-range model projects these percentages by using the same simulated work histories used to project the fully insured percentages. The long-range model makes additional adjustments to the model simulations in order to bring the disability insured percentages in the historical and short-range periods into close agreement with those estimated from the Continuous Work History Sample and the short-range model.
The office does not project the currently insured population because the number of beneficiaries who are entitled to benefits based solely on currently insured status has been very small and is likely to remain small in the future.
Using these insured models, the percentage of the Social Security area population aged 62 and over that is fully insured will increase from its estimated level of 82.9 for December 31, 2010, to 88.9, 89.5, and 90.3 for December 31, 2090, under the low-cost, intermediate, and high-cost alternatives, respectively. Over the projection period, the percentage for females increases significantly, reflecting the past substantial growth in the employment of younger cohorts of women. The percentage for males declines to a small degree, reflecting, in part, increases in the percent of the population that is classified as other immigrants and is thus less likely to have earnings reported and credited to them. Under the intermediate assumptions, for example, the percentage for males decreases slightly from 92.2 to 90.3, and the percentage for females increases from 75.5 to 88.7.
4. Old-Age and Survivors Insurance Beneficiaries
The Office of the Chief Actuary projects the number of OASI beneficiaries for each type of benefit separately by the sex of the worker on whose earnings the benefits are based and by the age of the beneficiary. For the long-range period, the office also projects the number of beneficiaries by marital status for several types of benefits. The office uses two separate models in making these projections. The short-range model makes projections during the first 10 years of the projection period and the long-range model makes projections thereafter.
The short-range model develops the number of retired-worker beneficiaries by applying award rates to the aged fully insured population, excluding those already receiving retired-worker, disabled-worker, aged-widow(er)’s, or aged-spouse’s benefits, and by applying termination rates to the number of retired-worker beneficiaries.
The long-range model projects the number of retired-worker beneficiaries who were not previously converted from disabled-worker beneficiary status as a percentage of the exposed population.4 For age 62, the model projects this percentage by using a linear regression based on the historical relationship between this percentage, the labor force participation rate at age 62, and the number of months from age 62 to normal retirement age. The percentage for ages 70 and over is nearly 100 because delayed retirement credits cannot be earned after age 70. The long-range model projects the percentage for each age 63 through 69 based on historical experience with an adjustment for changes in the portion of the primary insurance amount that is payable at each age of entitlement. The model adjusts these percentages for ages 62 through 69 to reflect changes in the normal retirement age.
The long-range model calculates the number of retired-worker beneficiaries previously converted from disabled-worker beneficiary status using an extension of disabled-worker death rates by age, sex, and duration.
The Office of the Chief Actuary estimates the number of aged-spouse beneficiaries, excluding those who are also receiving a retired-worker benefit, from the population projected by age and sex. Benefits of aged-spouse beneficiaries depend on the earnings records of their husbands or wives, who are referred to as “earners.” The short-range model projects insured aged-spouse beneficiaries in conjunction with the retired-worker beneficiaries. This model projects uninsured aged-spouse beneficiaries by applying award rates to the aged uninsured male or female population and by applying termination rates to the population already receiving such benefits.
The long-range model estimates aged-spouse beneficiaries separately for those married and divorced. The model projects the number of married aged-spouse beneficiaries, by age and sex, by applying a series of factors to the number of spouses, aged 62 and over, in the population. These factors are the probabilities that the spouse and the earner meet all of the conditions of eligibility — that is, the probabilities that: (1) the earner is 62 or over; (2) the earner is insured; (3) the earner is receiving benefits; (4) the spouse is not receiving a benefit for the care of an entitled child; (5) the spouse is not insured; and (6) the spouse is not eligible to receive a significant government pension based on earnings in noncovered employment. To calculate the estimated number of aged-spouse beneficiaries, the model applies a projected prevalence rate to the resulting number of spouses.
The long-range model estimates the number of divorced aged-spouse beneficiaries, by age and sex, by applying the same factors to the number of divorced persons aged 62 and over in the population, with three differences. First, the model applies a factor to reflect the probability that the earner (former spouse) is still alive. If the former spouse is not alive, the person may be entitled to a divorced widow(er)’s benefit. Second, the model applies a factor to reflect the probability that the marriage to the former spouse lasted at least 10 years. Third, the model does not apply factor (3) in the previous paragraph because, effective January 1985, a divorced person is generally no longer required to wait for the former spouse to receive benefits.
The Office of the Chief Actuary bases the projected numbers of children under age 18, and students aged 18 and 19, who are eligible for benefits as children of retired-worker beneficiaries, on the projected number of children in the population. The short-range model develops the number of entitled children by applying award rates to the number of children in the population who have two living parents and by applying termination rates to the number of children already receiving benefits.
The long-range model projects separately the number of entitled children by sex of the earner parent. For each age under 18, the model multiplies the projected number of children with a parent aged 62 and over by the ratio of the number of retired workers aged 62 to 71 to the number of members of the population aged 62 to 71. For student beneficiaries, the model multiplies the number of children aged 18 and 19 in the population by the probabilities that: (1) the parent is alive, aged 62 or over, insured, and receiving a retired-worker benefit; and (2) the child is attending high school.
The Office of the Chief Actuary projects the number of disabled children, aged 18 and over, of retired-worker beneficiaries from the adult population. The short-range model applies award rates to the population and applies termination rates to the number of disabled children already receiving benefits. The long-range model projects the number of disabled children in a manner similar to that used for student children except for a factor that reflects the probability of being disabled before age 22.
The short-range model develops the number of spouses of retired workers, who are entitled to spouse benefits because they are caring for a child who is under age 16 or disabled, by applying award rates to the number of awards to children of retired workers and by applying termination rates to the number of young spouses with a child in their care who are already receiving benefits. The long-range model projects the number of young-spouse beneficiaries with a child in their care as a proportion of the number of child beneficiaries of retired workers, including projected changes in average family size.
The Office of the Chief Actuary projects the number of aged-widow(er) beneficiaries, excluding those who are also receiving a retired-worker benefit, from the population by age and sex. The short-range model projects fully insured aged-widow(er) beneficiaries in conjunction with the retired-worker beneficiaries. The model projects the number of uninsured aged-widow(er) beneficiaries by applying award rates to the aged uninsured male or female population and by applying termination rates to the population already receiving such benefits. The long-range model projects uninsured aged-widow(er) beneficiaries by marital status. The model multiplies the number of widow(er)s in the population aged 60 and over by the probabilities that: (1) the deceased earner is fully insured at death; (2) the widow(er) is not receiving a benefit for the care of an entitled child; (3) the widow(er) is not fully insured; and (4) the widow(er)’s benefits are not withheld because of receipt of a significant government pension based on earnings in noncovered employment. In addition, the model applies the same factors to the number of divorced persons aged 60 and over in the population and includes additional factors representing the probability that the person’s former earner spouse has died and that the marriage lasted at least 10 years. The model projects the number of insured aged-widow(er) beneficiaries who are ages 60 through 70 in a manner similar to that for uninsured aged-widow(er) beneficiaries. In addition, the model assumes that some insured widow(er)s who had not applied for their retired-worker benefits will receive widow(er)’s benefits. The model projects insured aged-widow(er) beneficiaries over age 70 by applying termination rates to the population that started receiving such benefits prior to age 70.
The short-range model develops the number of disabled-widow(er) beneficiaries by applying award rates to the uninsured male or female population and by applying termination rates to the population already receiving a disabled-widow(er) benefit. The long-range model projects the number for each cohort by age from 50 to normal retirement age as percentages of the widowed and divorced populations, adjusted for the insured status of the deceased spouse, the prevalence of disability, and the probability that the disabled spouse is not receiving another type of benefit.
The Office of the Chief Actuary bases the projected number of children under age 18, and students aged 18 and 19, who are entitled to benefits as survivors of deceased workers, on the number of children in the population whose mothers or fathers are deceased. The short-range model develops the number of entitled children by applying award rates to the number of orphaned children and by applying termination rates to the number of children already receiving benefits.
The long-range model projects the number of child-survivor beneficiaries in a manner similar to that for student beneficiaries of retired workers, except that the model replaces the probability that the parent is aged 62 or over with the probability that the parent is deceased.
The Office of the Chief Actuary projects the number of disabled-child-survivor beneficiaries, aged 18 and over, from the adult population. The short-range model applies award rates to the population and applies termination rates to the number of disabled-child-survivor beneficiaries already receiving benefits. The long-range model projects the number of disabled-child-survivor beneficiaries in a manner similar to that for student-child-survivor beneficiaries, except for including an additional factor to reflect the probability of being disabled before age 22.
The short-range model develops the numbers of entitled mother-survivor and father-survivor beneficiaries by applying award rates to the number of awards to child-survivor beneficiaries, in cases where the children are either under age 16 or disabled, and by applying termination rates to the number of mother-survivors and father-survivors already receiving benefits. The long-range model estimates the numbers of mother-survivor and father-survivor beneficiaries, assuming they are not remarried, from the number of child-survivor beneficiaries.
The Office of the Chief Actuary projects the number of parent-survivor beneficiaries based on the historical pattern of the number of such beneficiaries.
Table V.C4 shows the projected number of beneficiaries under the OASI program by type of benefit. The retired worker beneficiary counts include those persons who receive a residual auxiliary benefit in addition to their retired-worker benefit. The office makes estimates of the number and amount of residual payments separately for spouses and widow(er)s.
 
Workera

a
Retired-worker beneficiaries include persons who also receive a residual benefit consisting of the excess of an auxiliary benefit over their retired-worker benefit.

Notes:
1. The number of beneficiaries does not include uninsured individuals who receive benefits under Section 228 of the Social Security Act. Transfers from the General Fund of the Treasury reimburse the OASI Trust Fund for the cost of most of these individuals.
2. Totals do not necessarily equal the sums of rounded components.
5. Disability Insurance Beneficiaries
The DI Trust Fund pays for benefits to disabled workers who: (1) satisfy the disability insured requirements; (2) are unable to engage in any substantial gainful activity due to a medically determinable physical or mental impairment severe enough to satisfy the requirements of the program; and (3) have not yet attained normal retirement age . Spouses and children of such disabled workers may also receive DI benefits provided they satisfy certain criteria, primarily age and earnings requirements.
The Office of the Chief Actuary projects the number of disabled-worker beneficiaries in current-payment status (disability prevalence) for each future year. The projections start with the number in current-payment status as of December 2012. Projections of the number of new beneficiaries awarded benefits each year (disability incidence) and the number of beneficiaries leaving the disability rolls each year then determine the number in current-payment status in later years. Beneficiaries leave the rolls due to death and recovery (disability terminations) and due to conversion from disabled-worker to retired-worker beneficiary status at normal retirement age, after which the OASI Trust Fund pays for benefits. The remainder of this section describes the concepts of disability incidence, termination, and prevalence.
a. Disability Incidence
The disability incidence rate is the ratio of the number of new beneficiaries awarded benefits each year to the number of individuals who meet insured requirements but are not yet receiving benefits (the disability-exposed population5). The Office of the Chief Actuary projects the number of newly awarded beneficiaries for each future year by multiplying assumed age-sex-specific disability incidence rates and the projected disability-exposed population by age and sex.
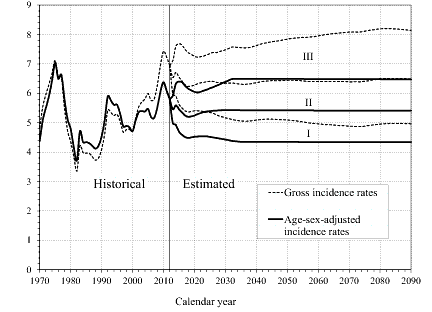
Figure V.C3 illustrates the historical and estimated incidence rates under the three alternatives. Incidence rates have varied substantially during the historical period since 1970 due to a variety of demographic and economic factors, along with changes in legislation and program administration. The solid lines in figure V.C3 show the incidence rate adjusted to the age-sex distribution of the disability-exposed population for 2000. This adjustment allows a comparison of incidence rates over time by focusing on the likelihood of becoming disabled, and by excluding the effects of a changing distribution of the population toward ages where disability is more or less likely.
The dashed lines in figure V.C3 represent the gross (unadjusted) incidence rates. The changing age‑sex distribution of the exposed population over time influences these unadjusted rates. The gross incidence rate fell substantially below the age‑sex-adjusted rate between 1975 and 1995 as the baby-boom generation swelled the size of the younger working-age population, where disability incidence is lower than in older populations. After 1995, the gross rate rose faster than the age‑sex-adjusted rate as the baby-boom generation moved into an age range where disability incidence peaks. After 2023, the projected gross incidence rate declines relative to the age-sex-adjusted rate as the baby-boom generation moves above the normal retirement age and the lower-birth-rate cohorts of the 1970s enter prime disability ages (50 to normal retirement age). As these smaller cohorts age beyond normal retirement age, by about 2050, the gross incidence rate returns to a higher relative level under the intermediate assumptions. Thereafter, the gross rate remains higher and reflects the persistently higher average age of the working-age population, which is largely due to lower birth rates since 1965.
For the first 10 years of the projection period (through 2022), incidence rates reflect several factors including: (1) aspects of program administration, such as efforts to reduce the disability backlog and recent changes to how claims are adjudicated; (2) assumed future unemployment rates; and (3) underlying trends in incidence. For this year’s report, all three sets of underlying economic assumptions include a gradual economic recovery with unemployment rates gradually declining to their ultimate sustainable levels. During the period of high unemployment, the projected disability incidence rates are above the general trend level. The elevated incidence rates subside as the economy recovers, and then briefly drop below the general trend level since some of the earlier additional awards would have occurred in a later year. After 2022, age-sex-specific incidence rates trend toward the ultimate rates assumed for the long-range projections and reach these ultimate rates in 2032. These ultimate age-sex-specific disability incidence rates were selected based on careful analysis of historical levels and patterns and expected future conditions, including the impact of scheduled increases in the normal retirement age.6 The ultimate incidence rates represent the expected average rates of incidence for the future.
For the intermediate alternative, the Trustees assume that the ultimate age-sex-adjusted incidence rate (adjusted to the disability-exposed population for the year 2000) will be 5.4 awards per thousand exposed, which is the same as in last year’s report. Figure V.C3 illustrates that the estimated ultimate age-sex-adjusted incidence rate of 5.4 is slightly higher than the average rate for the historical period 1970 through 2012, reflecting the increase in female incidence rates over this period. However, a similar comparison using gross incidence rates gives a different result. The estimated ultimate gross incidence rate is substantially greater than the average gross rate over the historical period due to the large changes in the age-sex distribution of the disability-exposed population between 1970 and 2010.
The Trustees assume that the ultimate age-sex-adjusted incidence rates for the low-cost and high-cost alternatives will be 4.3 and 6.5 awards per thousand exposed, or about 17 percent lower and 25 percent higher than the average for the historical period, respectively. These ultimate age-sex-adjusted incidence rates are similar to those in last year’s report.
 
b. Disability Termination
Beneficiaries stop receiving disability benefits when they die, recover from their medically-determinable disabling condition, or return to work. Disabled-worker beneficiaries who return to substantial work for an extended period are deemed to have recovered, and their benefits are then terminated. The termination rate is the ratio of the number of terminations for these reasons to the average number of disabled-worker beneficiaries during the year.
The Office of the Chief Actuary projects termination rates by age, sex, and reason for termination. In addition, the office projects termination rates by duration of entitlement to disabled-worker benefits in the long-range period (post-2022).
In the short-range period (through 2022), the projected age-sex-adjusted death rate (adjusted to the 2000 disabled-worker population) under the intermediate assumptions gradually declines from 26.5 deaths per thousand beneficiaries in 2012 to about 22.3 per thousand by 2022. The projected age-sex-adjusted recovery rate (medical improvement and return to work) under the intermediate assumptions rises from a level of 9.7 per thousand beneficiaries in 2012 (reflecting temporarily lower levels of continuing disability reviews) to 11.4 per thousand beneficiaries by 2022. Under the low-cost and high-cost assumptions, total age-sex-adjusted termination rates due to death and recovery are roughly 10-15 percent higher or lower, respectively, than under the intermediate assumptions.
For the long-range period (post-2022), the Office of the Chief Actuary projects death and recovery rates by age, sex, and duration of entitlement relative to the average level of rates experienced over the base period 2001-2005. The assumed ultimate age-sex-adjusted recovery rate for disabled workers is about 10.4 per thousand beneficiaries. The assumed ultimate age-sex-adjusted recovery rates for the low-cost and high-cost alternatives are about 12.5 and 8.3 recoveries per thousand beneficiaries, respectively. Recovery rates by age, sex, and duration of entitlement reach ultimate levels in the twentieth year of the projection period (2032) for all three sets of assumptions. In contrast, death rates by age and sex change throughout the long-range period at the same rate as death rates in the general population. From the age-sex-adjusted death rate of 26.5 per thousand beneficiaries in 2012, this rate decreases to 17.8, 11.0, and 6.4 per thousand disabled-worker beneficiaries for 2090 under the low-cost, intermediate, and high-cost assumptions, respectively.
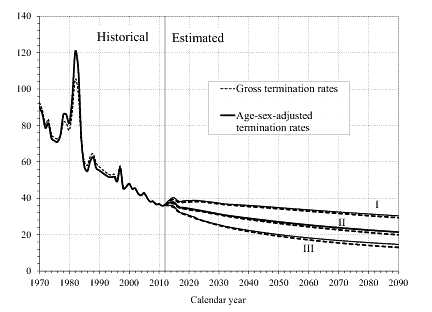
Figure V.C4 illustrates gross and age-sex-adjusted total termination rates for disabled-worker beneficiaries for the historical period since 1970, and for the projection period through 2090. In the near term, through 2016, recovery terminations are projected to increase, consistent with the assumption that the Social Security Administration will receive sufficient budget appropriations to reduce the pending backlog of continuing disability reviews. As with incidence rates, the age-sex-adjusted termination rate illustrates the real change in the tendency to terminate benefits. Changes in the age-sex distribution of the beneficiary population influence the gross termination rate. A shift in the beneficiary population to older ages, as occurred over the past 20 years when the baby-boom generation moved into pre-retirement ages, increases gross death termination rates relative to the age-sex-adjusted rates.
 
c. Comparison of Incidence, Termination, and Conversion
Incidence and termination rates are the foundation for projecting the number of disabled-worker beneficiaries in current-payment status. At normal retirement age, disabled-worker beneficiaries convert to retired-worker status and leave the DI rolls.
Figure V.C5 compares the historical and projected (intermediate) levels of incidence, termination, and conversion on both a gross basis and an age-sex-adjusted basis. Incidence rates have varied widely, and, on an age-sex-adjusted basis under the intermediate assumptions, the Trustees expect them to remain near the middle of the high and low extremes experienced since 1970. Termination rates have declined and the Trustees expect them to continue to decline, largely because of declining death rates.
Conversions are simply a transfer of beneficiaries at normal retirement age from the DI Trust Fund account to the OASI Trust Fund account. Therefore, the disability “conversion” rate is 100 percent for disabled-worker beneficiaries reaching normal retirement age in a given year and zero at all other ages. After conversion, recovery from the disabling condition is no longer relevant. The conversion ratio is the number of conversions in a given year (that is, beneficiaries who reach normal retirement age) divided by the average number of disabled-worker beneficiaries at all ages in that year. The ratio is constant on an age-sex-adjusted basis, except for the two periods during which normal retirement age increases under current law. On a gross basis, however, the conversion ratio rises and falls with the changing proportion of all disabled-worker beneficiaries who attain normal retirement age in a given year. The gross conversion ratio generally increases from 2002 to 2030 due to aging of the beneficiary population.
 
d. DI Beneficiaries and Disability Prevalence Rates
The Office of the Chief Actuary makes detailed projections of disabled-worker awards, terminations, and conversions and combines these to project the number of disabled workers receiving benefits over the next 75 years. Table V.C5 presents the projected numbers of disabled workers in current-payment status. The number of disabled workers in current-payment status grows from 8.8 million at the end of 2012, to 12.7 million, 14.4 million, and 15.2 million at the end of 2090, under the low-cost, intermediate, and high-cost assumptions, respectively. Of course, much of this growth results from the growth and aging of the population described earlier in this chapter. Table V.C5 also presents projected numbers of auxiliary beneficiaries and disability prevalence rates on both a gross basis and an age-sex-adjusted basis.
 
Age-sex- adjusteda

a
Adjusted to the age-sex distribution of the insured population for the year 2000.

Note: Totals do not necessarily equal the sums of rounded components.
The disability prevalence rate is the ratio of the number of disabled-worker beneficiaries in current-payment status to the number of persons insured for disability benefits. Figure V.C6 illustrates the historical and projected disability prevalence rates on both a gross basis and on an age-sex-adjusted basis (adjusted to the age-sex distribution of the insured population for the year 2000).
Changes in prevalence rates are a direct result of changes in incidence rates and termination rates. Figure V.C5 depicts patterns for incidence and termination rates, which are helpful for understanding the trend in prevalence rates. Annual incidence and termination rates are not directly comparable or combinable because their denominators differ.
 
Age-sex-adjusted prevalence rates have increased primarily because: (1) termination rates have declined; (2) incidence rates at younger ages have increased relative to rates at older ages; and (3)  incidence rates have increased substantially for women to parity with men. Gross prevalence rates have increased more than age-sex-adjusted prevalence rates ever since the baby-boom generation began to reach ages 45 through normal retirement age, a time of life when disability incidence rates are relatively high. The Office of the Chief Actuary projects both gross and age-sex adjusted prevalence rates to grow at a slower pace based on assumed stabilization in three factors: (1) the age distribution of the general population; (2) the age distribution of the disability insured population; and (3) incidence rates by age and gender. As these factors gradually stabilize, the declining death termination rate continues to have a small influence toward higher disability prevalence rates.
As mentioned above in the discussion of incidence and termination rates, the age-sex-adjusted prevalence rate isolates the changing trend in the underlying likelihood of receiving benefits for the insured population, without reflecting changes in the age distribution of the population. As with incidence rates, gross disability prevalence rates declined relative to the age-sex-adjusted rate when the baby-boom generation reached working age between 1970 and 1990; this trend reflects the lower disability prevalence rates associated with younger ages. Conversely, the gross rate of disability prevalence has increased relative to the age-sex-adjusted rate after 1990 due to the aging of the baby-boom generation into ages with higher disability prevalence rates.
Under the intermediate assumptions, the projected age-sex-adjusted disability prevalence rate grows from 46.2 per thousand disability insured at the end of 2012 to 49.8 per thousand at the end of 2090. As mentioned above, the Office of the Chief Actuary projects that the growth in prevalence will slow relative to the historical period.
Under the low-cost and high-cost assumptions, the age-sex-adjusted disability prevalence rate decreases to 38.0 per thousand and increases to 62.1 per thousand insured workers at the end of 2090, respectively.
Table V.C5 presents projections of the numbers of auxiliary beneficiaries paid from the DI Trust Fund. As indicated at the beginning of this subsection, auxiliary beneficiaries are qualifying spouses and children of disabled workers. A spouse must either be at least age 62 or have an eligible child beneficiary in his or her care who is either under age 16 or disabled prior to age 22. A child must be: (1) under age 18; (2) age 18 or 19 and still a student in high school; or (3) age 18 or older and disabled prior to age 22.
The projection of the number of auxiliary beneficiaries relies on the projected number of disabled-worker beneficiaries. In the short-range period (2013-22), the Office of the Chief Actuary projects incidence and termination rates for each category of auxiliary beneficiary. After 2022, the office projects child beneficiaries at ages 18 and under in relation to the projected number of children in the population using the probability that either of their parents is a disabled-worker beneficiary. The office projects the remaining categories of children and spouses in a similar manner.
6. Covered and Taxable Earnings, Taxable Payroll, and Payroll Tax Contributions
Covered earnings are the sum of covered wages and covered self-employment net earnings. The Office of the Chief Actuary projects covered wages for component sectors of the economy (i.e., private, State and local, Federal civilian, and military) based on the projected overall growth of sectoral and total wages in the U.S. economy. The projections of covered wages also reflect changes in covered employment due to a relative increase in non-covered undocumented immigrants and to the mandatory coverage of new hires in the Federal civilian sector. The office projects covered self-employment net earnings based on the growth in net proprietors’ income in the U.S. economy.
Taxable earnings are the amount of covered earnings subject to the Social Security payroll tax. Taxable wages for an employee are total covered wages from all wage employment up to the contribution and benefit base. Taxable wages for an employer are the sum of all covered wages paid to each employee up to the base. Employees with multiple jobs whose total wages exceed the base are eligible for a refund of excess employee taxes withheld; employers are not eligible for a refund on this basis. For self-employed workers with no taxable wages, taxable earnings are the amount of covered self-employment net earnings up to the base. For self-employed workers with taxable wages less than the base, covered self-employment net earnings are taxable up to the difference between the base and their taxable wages. For projection purposes, the Office of the Chief Actuary computes taxable earnings based on a proportion of covered earnings that is at or below the base.
The OASDI taxable payroll (see table VI.F6) for a year is the amount of earnings which, when multiplied by the combined OASDI employee-employer payroll tax rate for that year, yields the total amount of payroll taxes due from wages paid and self-employment net earnings for the year. The Trustees use taxable payroll to determine income rates, cost rates, and actuarial balances. Taxable payroll is derived by adjusting total taxable earnings to account for categories of earnings that are taxed at rates other than the combined employee-employer rate and to take into account amounts credited as wages that were not included in normally reported wages. For 1951 and later, taxable earnings are reduced by one-half of the amount of wages paid to employees with multiple jobs that exceed the contribution and benefit base. For 1983 through 2001, deemed wage credits for military service after 1956 are added to taxable earnings. The self-employment tax rates for 1951 through 1983 were less than the combined employee-employer rates; therefore, the self-employment component of taxable payroll for those years is reduced by multiplying the ratio of the self-employment rate to the combined employee-employer rate times the taxable self-employment net earnings. Finally, for 1966 through 1979, employers were exempt from paying their share of payroll tax on their employees’ tips and, for 1980 through 1987, employers paid tax on only part of their employees’ tips. For those years, the taxable payroll is reduced by half of the amount of tips for which the employer owed no payroll tax.
The ratio of taxable payroll to covered earnings (the taxable ratio) fell from 88.3 percent for 1984 to 82.4 percent for 2000, mostly due to much higher increases in wage levels for very high earners than for all other earners. From 2000 to 2010, the taxable ratio varied with the business cycle, rising during economic downturns and falling during recoveries. Specifically, the taxable ratio rose to 85.5 percent for 2002, declined to 82.2 percent for 2007, rose to 85.0 percent for 2009, and was 83.2 percent for 2011.
For the 2013 report, the Trustees assume a level for the taxable ratio for 2022 of 82.5 percent for the intermediate assumptions, 81.0 percent for the high-cost assumptions (or 1.5 percentage points lower than the intermediate assumptions), and 84.0 percent for the low-cost assumptions (or 1.5 percentage points higher than the intermediate assumptions). These are the same assumptions that the Trustees made for the 2012 report.
The Office of the Chief Actuary projects payroll tax contributions using the patterns of tax collection required by Federal laws and regulations. The office determines payroll tax liabilities by multiplying the scheduled tax rates for each year by the amount of taxable wages and self-employment net earnings for that year. The office then splits these liabilities into amounts by collection period. For wages, Federal law requires that employers withhold OASDI and HI payroll taxes and Federal individual income taxes from employees’ pay. As an employer’s accumulation of such taxes (including the employer share of payroll taxes) meets certain thresholds, which the Department of the Treasury determines, the employer must deposit these taxes with the U.S. Treasury by a specific day, depending on the amount of money involved7. For projection purposes, the office splits the payroll tax contributions related to wages into amounts paid in the same quarter as incurred and in the following quarter. Self-employed workers must make estimated tax payments on their earnings four times during the year and to make up any underestimate on their individual income tax returns. The projection splits the self-employed tax liabilities by collection quarter to reflect this pattern of receipts.
The projected tax contributions also reflect the method used to insure that money transferred to the trust funds is adjusted, over time, to equal the actual liability owed. Because payers generally make tax payments without identifying the separate OASDI contribution amounts, Treasury makes daily transfers of money from the general fund to the trust funds on an initial estimated basis. The Social Security Administration periodically certifies the amounts of wages and self-employment net earnings on which tax contributions are owed for each year, at which time Treasury determines adjustments to appropriations to reconcile tax liabilities with deposits in the trust funds. This process also includes periodic transfers from the trust funds to the general fund for contributions on wages in excess of the contribution and benefit base.
Table V.C6 shows the payroll tax contribution rates applicable under current law in each calendar year and the allocation of these rates between the OASI and DI Trust Funds.8 It also shows the contribution and benefit base for each year through 2013.
 
Employees and employers, combineda
Self-employed2
1984 c
2010d

a
Except as noted below, the combined employee/employer rate is divided equally between employees and employers.

b
Beginning in 1990, self-employed persons receive a deduction, for purposes of computing their net earnings, equal to half of the combined OASDI and HI contributions that would be payable without regard to the contribution and benefit base. The OASDI contribution rate then applies to net earnings after this deduction, but subject to the OASDI base.

c
In 1984 only, employees received an immediate credit of 0.3 percent of taxable wages against their OASDI payroll tax contributions. The self-employed received similar credits of 2.7 percent, 2.3 percent, and 2.0 percent against their combined OASDI and Hospital Insurance (HI) contributions on net earnings from self-employment in 1984, 1985, and 1986-89, respectively. The General Fund of the Treasury reimbursed the trust funds for these credits.

d
Public Law 111-147 exempted most employers from paying the employer share of OASDI payroll tax on wages paid during the period March 19, 2010 through December 31, 2010 to certain qualified individuals hired after February 3, 2010. Public Law 111-312 reduced the OASDI payroll tax rate for 2011 by 2 percentage points for employees and for self-employed workers. Public Law 112-96 extended the 2011 rate reduction through 2012. These laws require that the General Fund of the Treasury reimburse the OASI and DI Trust Funds for these temporary reductions in 2010 through 2012 payroll tax revenue, in order to “replicate to the extent possible” revenue that would have been received if the combined employee/employer payroll tax rates had remained at 12.4 percent for OASDI (10.6 percent for OASI and 1.8 percent for DI).

e
Subject to automatic adjustment based on increases in average wages.

7. Income From Taxation of Benefits
Under current law, the OASI and DI Trust Funds are credited with income tax revenue from the taxation of up to the first 50 percent of OASI and DI benefit payments. (The HI Trust Fund receives the remainder of the income tax revenue from the taxation of up to 85 percent of OASI and DI benefit payments.)
For the short-range period, the Office of the Chief Actuary estimates the income to the trust funds from taxation of benefits by applying the following two factors (projected by the Office of Tax Analysis, Department of the Treasury) to total OASI and DI scheduled benefits: (1) the percentage of scheduled benefits (limited to 50 percent) that is taxable; and (2) the average marginal tax rate applicable to those benefits.
For the long-range period, the office estimates the income to the trust funds from taxation of benefits by applying projected ratios of taxation of OASI and DI benefits to total OASI and DI scheduled benefits. The income thresholds used for benefit taxation are, by law, constant in the future, while income and benefit levels continue to rise. Accordingly, projected ratios of income from taxation of benefits to the amount of benefits increase gradually. Ultimate tax ratios for OASI and DI benefits used in the projection rely on estimates from the Office of Tax Analysis in the Department of the Treasury.
8. Average Benefits
Projections of average benefits for each benefit type reflect recent historical averages, projected average primary insurance amounts (PIAs), and projected ratios of average benefits to average PIAs. Calculations of average PIAs are based on projected distributions of beneficiaries by duration from year of initial entitlement, average PIAs at initial entitlement, and increases in PIAs after initial entitlement. Projected increases in average PIAs after initial entitlement depend on automatic benefit increases, recomputations to reflect additional covered earnings, and differences in mortality by level of lifetime earnings. Calculations of future average PIAs at initial entitlement are based on projected earnings histories, which in turn reflect a combination of the actual earnings histories associated with a sample of 2008 initial entitlements and more recent actual earnings levels by age and sex for covered workers.
For retired-worker, aged-spouse, and aged-widow(er) benefits, the percentage of the PIA that is payable depends on the age at initial entitlement to benefits. Projected ratios of average benefits to average PIAs for these types of benefits are based on projections of age distributions at initial entitlement.
9. Scheduled Benefits
For each type of benefit, scheduled benefits are the product of the number of beneficiaries and the corresponding average monthly benefit. The short-range model calculates scheduled benefits on a quarterly basis. The long-range model calculates all scheduled benefits on an annual basis, using the number of beneficiaries at the beginning and end of the year. Adjustments to these annual scheduled benefits include retroactive payments to newly awarded beneficiaries and other amounts not reflected in the regular monthly scheduled benefits.
Scheduled lump-sum death benefits are estimated as the product of: (1) the number of lump-sum death payments projected on the basis of the assumed death rates, the projected fully insured population, and the estimated percentage of the fully insured population that will qualify for lump-sum death payments; and (2) the amount of the lump-sum death payment, which is $255 (unindexed since 1973).
10. Illustrative Scheduled Benefit Amounts
Table V.C7 shows, under the intermediate assumptions, future benefit amounts payable upon retirement at the normal retirement age and at age 65, for workers attaining age 65 in 2013 and subsequent years. The table shows illustrative benefit amounts for workers with four separate pre-retirement earnings patterns. The benefit amounts in table V.C7 are presented in CPI-indexed 2013 dollars—that is, adjusted to 2013 levels by the CPI indexing series shown in table VI.F6. Table V.C7 also shows each benefit amount as a percentage or “replacement rate” of career-average earnings, indexed by national average wage growth to the year prior to retirement. For these scaled worker profiles, this method of calculation produces percentages that may differ significantly from those that would be produced by comparing benefits to these representative workers’ recent average earnings levels or to other more common measures of pre-retirement income. The Trustees are exploring whether to expand or otherwise modify this presentation in the 2014 Trustees Report.
The normal retirement age was 65 for individuals who reached age 62 before 2000. It increased to age 66 during the period 2000-05, at a rate of 2 months per year as workers attained age 62. Under current law, the normal retirement age will increase to age 67 during the period 2017-22, also by 2 months per year as workers attain age 62. The illustrative benefit amounts shown in table V.C7 for retirees at age 65 are lower than the amounts shown for retirees at normal retirement age because the statute requires actuarial reduction of benefits taken before normal retirement age.
Table V.C7 shows five different pre-retirement earnings patterns. Four of these patterns assume the earnings history of workers with scaled-earnings patterns9 and reflect very low, low, medium, and high career-average levels of pre-retirement earnings starting at age 21. The fifth pattern assumes the earnings history of a steady maximum earner. The four scaled-earnings patterns derive from earnings experienced by insured workers during 1991‑2009. These earnings levels differ by age. The career-average level of earnings for each scaled case targets a percent of the national average wage index (AWI). As a result, the benefit amounts shown here are consistent with the levels for “steady-earnings” cases presented in the 2000 and earlier Trustees Reports. Since 2001, the Trustees have used scaled-earnings cases, instead of steady-earnings cases, because they better illustrate the differences in benefit levels under the wide variety of reform proposals considered in recent years.
For the scaled medium earner, the career-average earnings level is about equal to the AWI (or $44,826 for 2013). For the scaled very low, low, and high earners, the career-average earnings level is about 25 percent, 45 percent, and 160 percent of the AWI, respectively (or $11,207, $20,172, and $71,722, respectively, for 2013). The steady maximum earner has earnings at or above the contribution and benefit base for each year starting at age 22 through the year prior to retirement (or $113,700 for 2013).
 
Table V.C7.—Annual Scheduled Benefit Amountsa for Retired Workers
With Various Pre-Retirement Earnings Patterns
Based on Intermediate Assumptions, Calendar Years 2013-90 
Year attain age 65 b
CPI-indexed
2013
dollars   c
Scaled very low earnings:d
Scaled low earnings:e
Scaled medium earnings:f
Scaled high earnings:g
Steady maximum earnings: h

a
Annual amounts are the total for the 12-month period starting with the month of retirement.

b
Attains age 65 on January 1 of the year.

c
CPI-indexed dollar adjustment uses the adjusted CPI indexing series shown in table VI.F6.

d
Career-average earnings at about 25 percent of the national average wage index (AWI).

e
Career-average earnings at about 45 percent of the AWI.

f
Career-average earnings at about 100 percent of the AWI.

g
Career-average earnings at about 160 percent of the AWI.

h
Earnings for each year at or above the contribution and benefit base.

11. Administrative Expenses
The projection of administrative expenses through 2022 is based on historical experience and the projected growth in average wages. The Office of Budget of the Social Security Administration provides estimates for the first several years of the projection. For years after 2022, projected administrative expenses reflect increases in the number of beneficiaries and increases in the average wage. However, the increases in average wage are partially offset by assumed administrative productivity gains.
12. Railroad Retirement Financial Interchange
Railroad workers are covered under a separate multi-tiered benefit plan, with a first tier of coverage similar to OASDI coverage. An annual financial interchange between the Railroad Retirement fund and the OASI and DI Trust Funds is made to resolve the difference between: (1) the amount of OASDI benefits that would be paid to railroad workers and their families if railroad employment had been covered under the OASDI program, plus administrative expenses associated with these benefits; and (2) the amount of OASDI payroll tax and income tax that would be received with allowances for interest from railroad workers.
Calculation of the financial interchange with the Railroad Retirement reflects trends similar to those used in estimating the cost of OASDI benefits. The annual short-range net cost for the OASI and DI Trust Funds ranges from $4 ‑ 6 billion and the long-range summarized net cost for the OASI and DI Trust Funds is 0.03 percent of taxable payroll.
13. Military Service Transfers
Beginning in 1966, the General Fund of the Treasury reimbursed the OASI and DI Trust Funds annually for the cost (including administrative expenses) of providing additional benefit payments resulting from noncontributory wage credits for military service performed prior to 1957. The 1983 amendments modified the reimbursement mechanism and the timing of the reimbursements, and required a reimbursement in 1983 to include all future costs attributable to the wage credits. The amendments also require adjustments to that 1983 reimbursement every fifth year, beginning with 1985, to account for actual data.
 

1
The Federal Register publishes details of these indexation procedures annually. Also see
www.socialsecurity.gov/OACT/COLA/index.html.

2
For those under age 16, projected covered employment is the sum of age-sex components, each of which the office projects as a ratio to the Social Security area population.

3
Age-adjusted covered worker rates are adjusted to the 2011 age distribution of the Social Security area population.

4
The exposed population is the fully insured population age 62 and over, excluding persons entitled to or converted from disabled-worker benefits and fully insured persons entitled only to widow(er)’s benefits.

5
The disability-exposed population excludes those receiving benefits, while the disability insured population includes them. Section V.C.3 of this report describes the projection of the disability insured population.

6
Projected incidence rates are adjusted upward to account for additional workers who are expected to file for disability benefits (rather than retirement benefits) in response to reductions in retirement benefits as the normal retirement age rises.

7
Generally, the higher the amount of liability, the sooner the taxes must be paid. For smaller employers, payment is due by the middle of the month following when the liability was incurred. Medium-size employers have three banking days in which to make their deposits. Larger employers must make payment on the next business day after paying their employees.

8
Table VI.F1 shows the payroll tax contribution rates for the Hospital Insurance (HI) program.

9
Actuarial Note Number 2012.3 has more details on scaled-earnings patterns.
See
www.socialsecurity.gov/OACT/NOTES/ran3/an2012-3.html.


Table of Contents Previous Next Tables Figures Index
SSA Home | Privacy Policy | Website Policies & Other Important Information | Site Map | Actuarial Publications May 31, 2013