Social Security Administration
before the House Committee on Ways and Means,
Subcommittee on Social Security
March 14, 2013
Chairman Johnson, Ranking Member Becerra, and members of the subcommittee, thank you very much for the opportunity to speak to you today about the Social Security Disability Insurance (DI) program. I would like to share thoughts on five topics:
- An update on the projected financial status of the DI Trust Fund;
- The “drivers” of increasing costs over the past several decades;
- The Trustees’ assumptions for future trends in cost;
- Changes in the distribution of disabled workers by age and medical diagnosis; and
- Past and projected numbers of full medical continuing disability reviews (CDRs).
(1) The Financial Status of the Disability Insurance Program
The Disability Insurance (DI) Trust Fund was just one year away from depletion of its reserves back in 1994, when the Congress enacted a reallocation of the Social Security 12.4-percent payroll tax rate, providing a little more for DI, but no change in the total tax rate. In the 1995 Trustees Report, we projected that DI Trust Fund reserves would remain adequate until 2016.
For the most recent Trustees Report published in April of 2012, we projected that DI Trust Fund reserves would again be adequate until 2016, and that, after the reserves become depleted, we would still have sufficient tax revenue to pay 79 percent of scheduled benefits in 2016, rising to 80 percent by 2086.
Figure 1: Status of Social Security OASI and DI Trust Funds
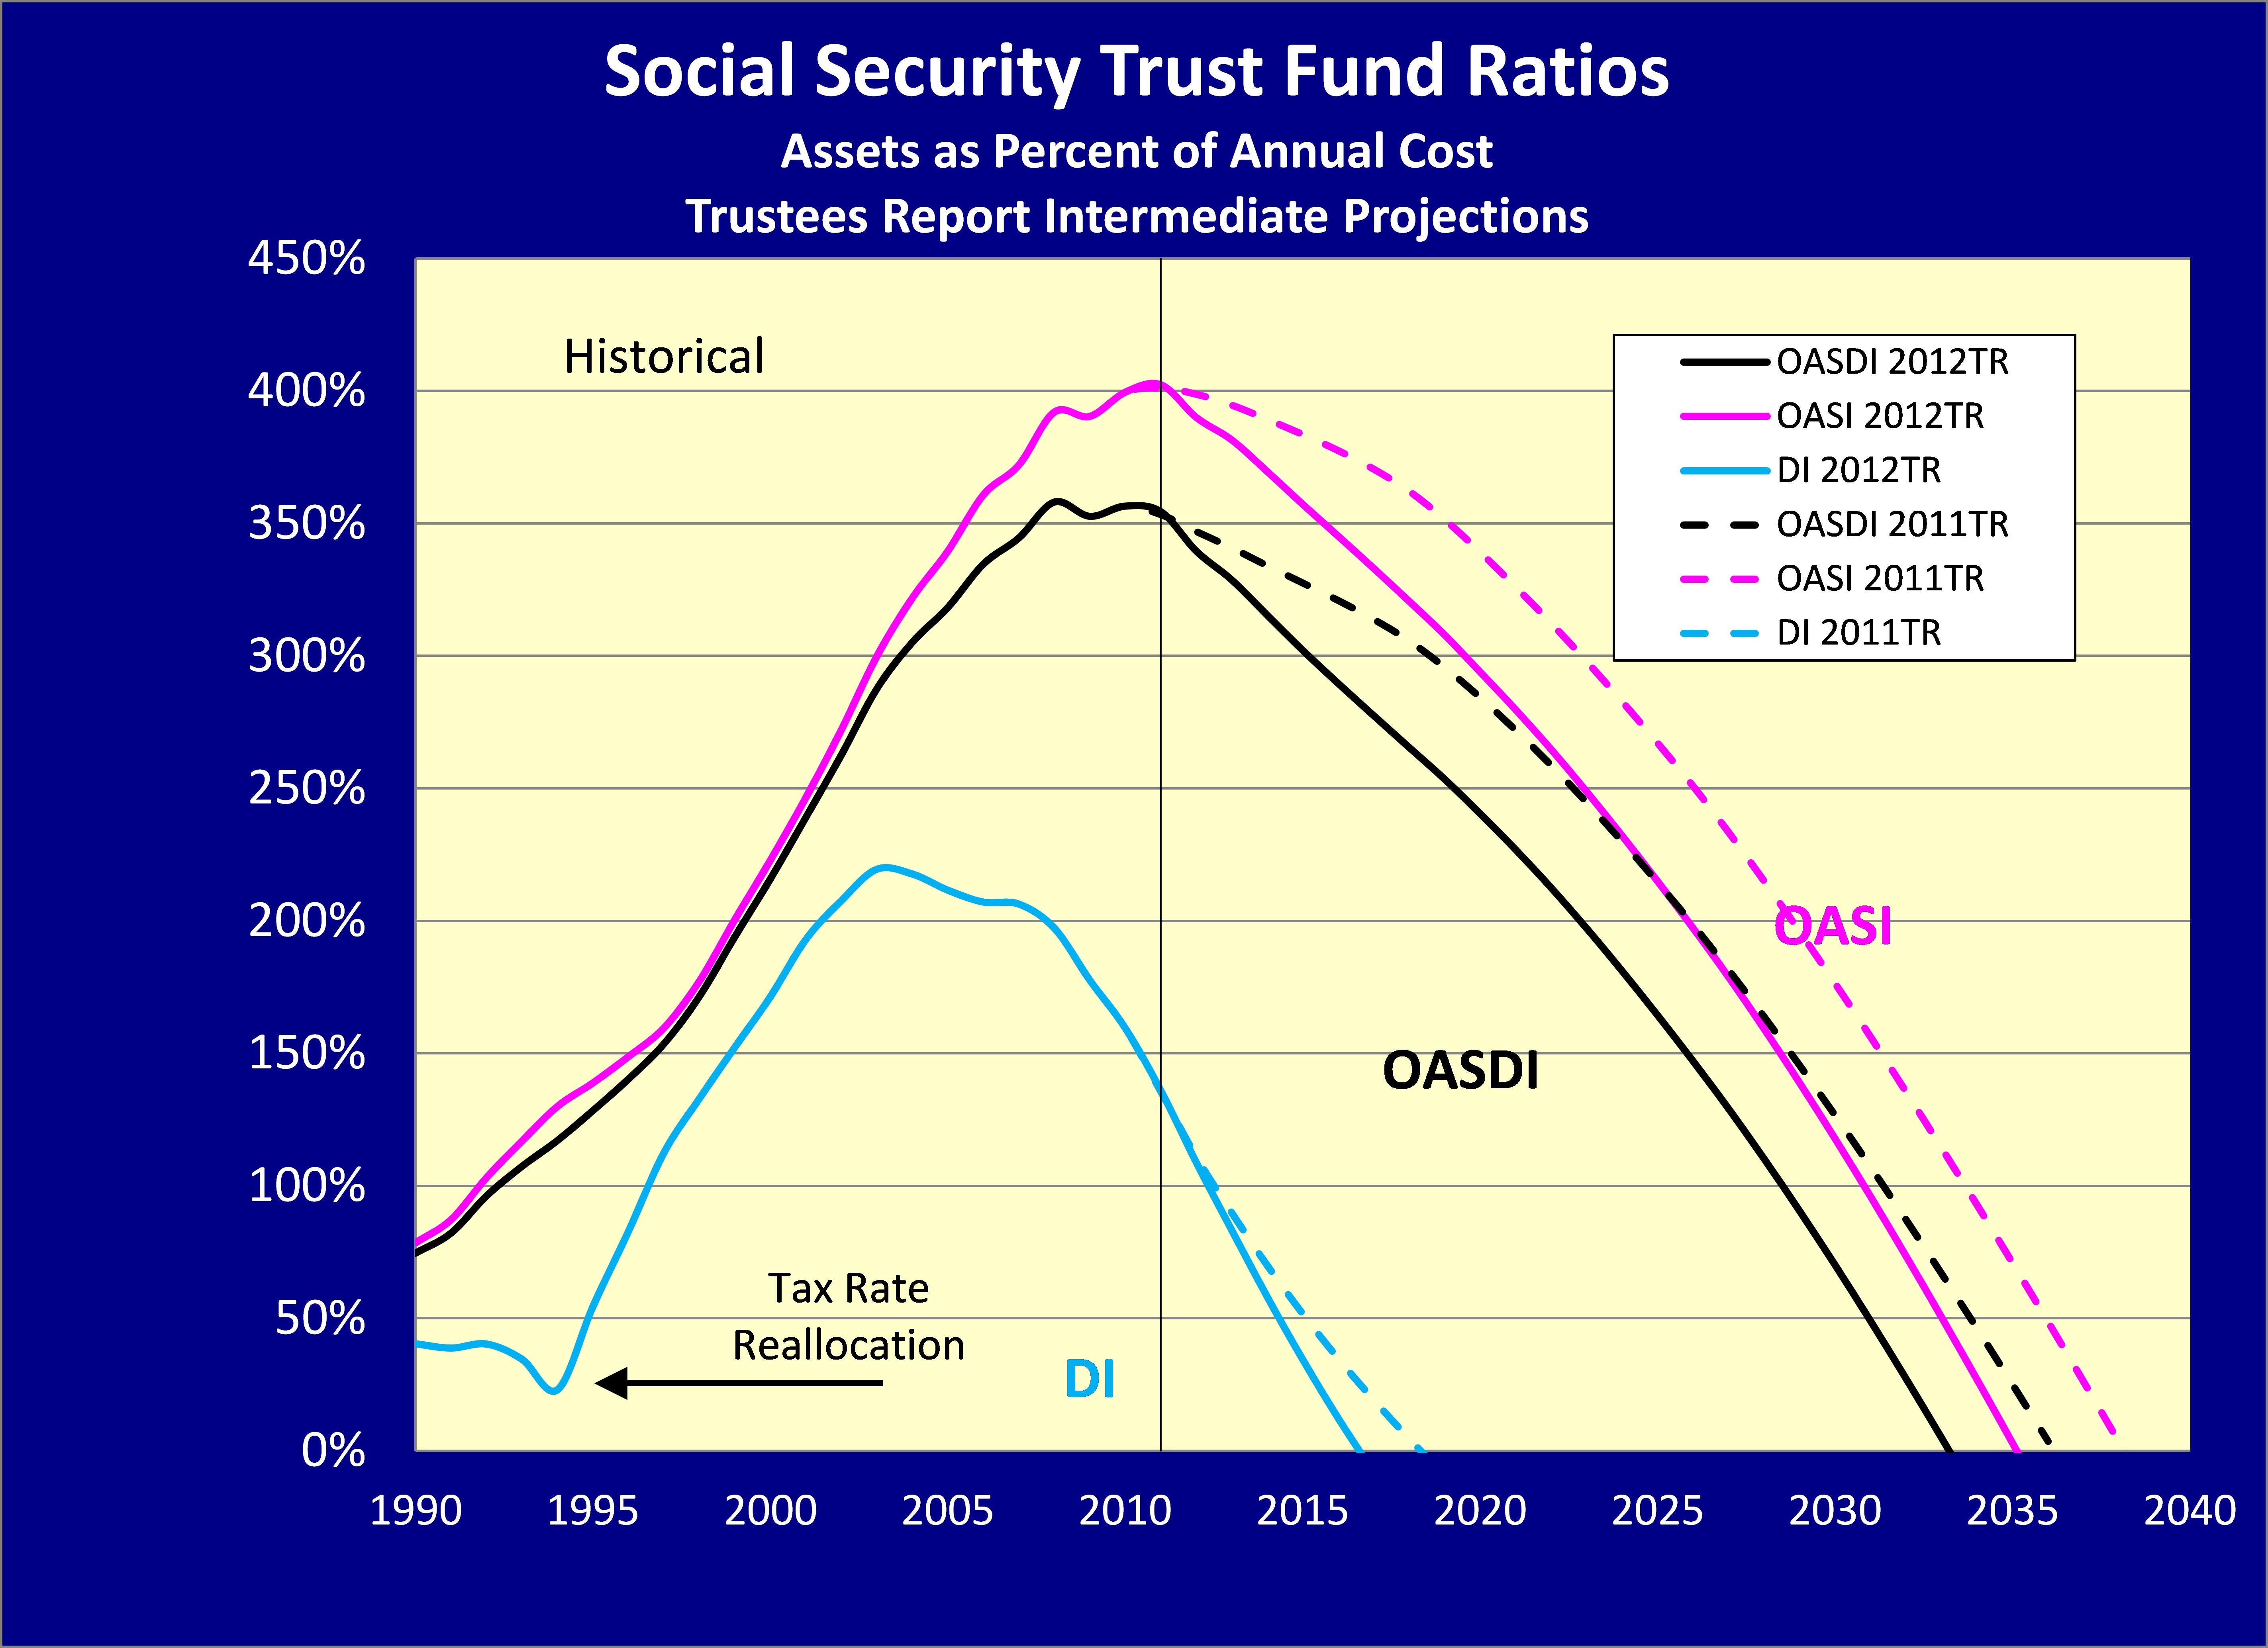
Note: OASI refers to the Social Security Old-Age and Survivors Insurance Program. OASDI is a combination of the OASI and the DI Insurance Programs.
Sustainable solvency can be restored for the DI Trust Fund with a 16-percent reduction in program cost, a 20-percent increase in revenue, or some combination of these changes. Even a simple tax-rate reallocation between OASI and DI, as was done in 1994, could equalize the financial prospects of the trust funds avoiding reserve depletion until 2033.
Overall OASDI cost will rise over the next 20 years as the baby boomers retire and are replaced in the working ages with lower-birth-rate generations born after 1965. The drop in birth rates after 1965 will cause a permanent shift in the age distribution of the population, with fewer workers to support more elderly retirees in the future.
However, the baby boomers already moved from young ages (25-44) in 1990, where few were disabled, to older ages (45-64) in 2010, where many more are disabled.
Thus, the 20-year demographic shift in the age distribution of the population due to lower birth rates has already occurred for DI. This, along with stabilization of other “drivers” described below, results in a flat projected number of workers per DI beneficiary for the future.
Therefore, restoring sustainable solvency for the DI program will not require continually greater benefit cuts or revenue increases. A one-time change to offset the drop in birth rate and past shifts in other “drivers” is all that is needed to sustain the DI program for the foreseeable future.
(2) The “Drivers” of the Cost of the Disability Insurance Program
Changes in the cost of the DI program as a percent of payroll or GDP reflect changes in the numbers of beneficiaries per tax-paying worker because average benefit levels and average earnings levels rise at about the same rate. The number of disabled worker beneficiaries increased from 2.86 million in 1980 to 8.20 million in 2010, an increase of 187 percent (while the number of workers rose by just 39 percent). Several main “drivers” have caused this disproportionate increase in the number of beneficiaries.
The first driver is the 41-percent increase in the total population at ages 20 through 64 between 1980 and 2010, which roughly matches the increase in workers.
The second driver is the changing age distribution described above, which resulted in a 38-percent increase in “prevalence” of disability. (The gross disability prevalence rate grew 38 percent more than the age-sex-adjusted prevalence rate between 1980 and 2010.)
The third driver is the percent of the population at ages 20 through 64 that is disability insured. Since 1970, the disability insured population grew substantially as increasing numbers of women worked consistently and stayed insured. Between 1980 and 2010, the percent of the “disability-age” population that was insured rose from about 50 to 68 percent for women, but declined from about 77 to 74 percent for men. Overall, there was a net 8-percent increase in the number of disabled worker beneficiaries. This increase is relatively small because the proportion of the population that is undocumented (and far less likely to become disability insured) rose substantially between 1980 and 2010. Without this increased proportion of the population that is undocumented, the percent insured would have increased more for women and declined less (if at all) for men.
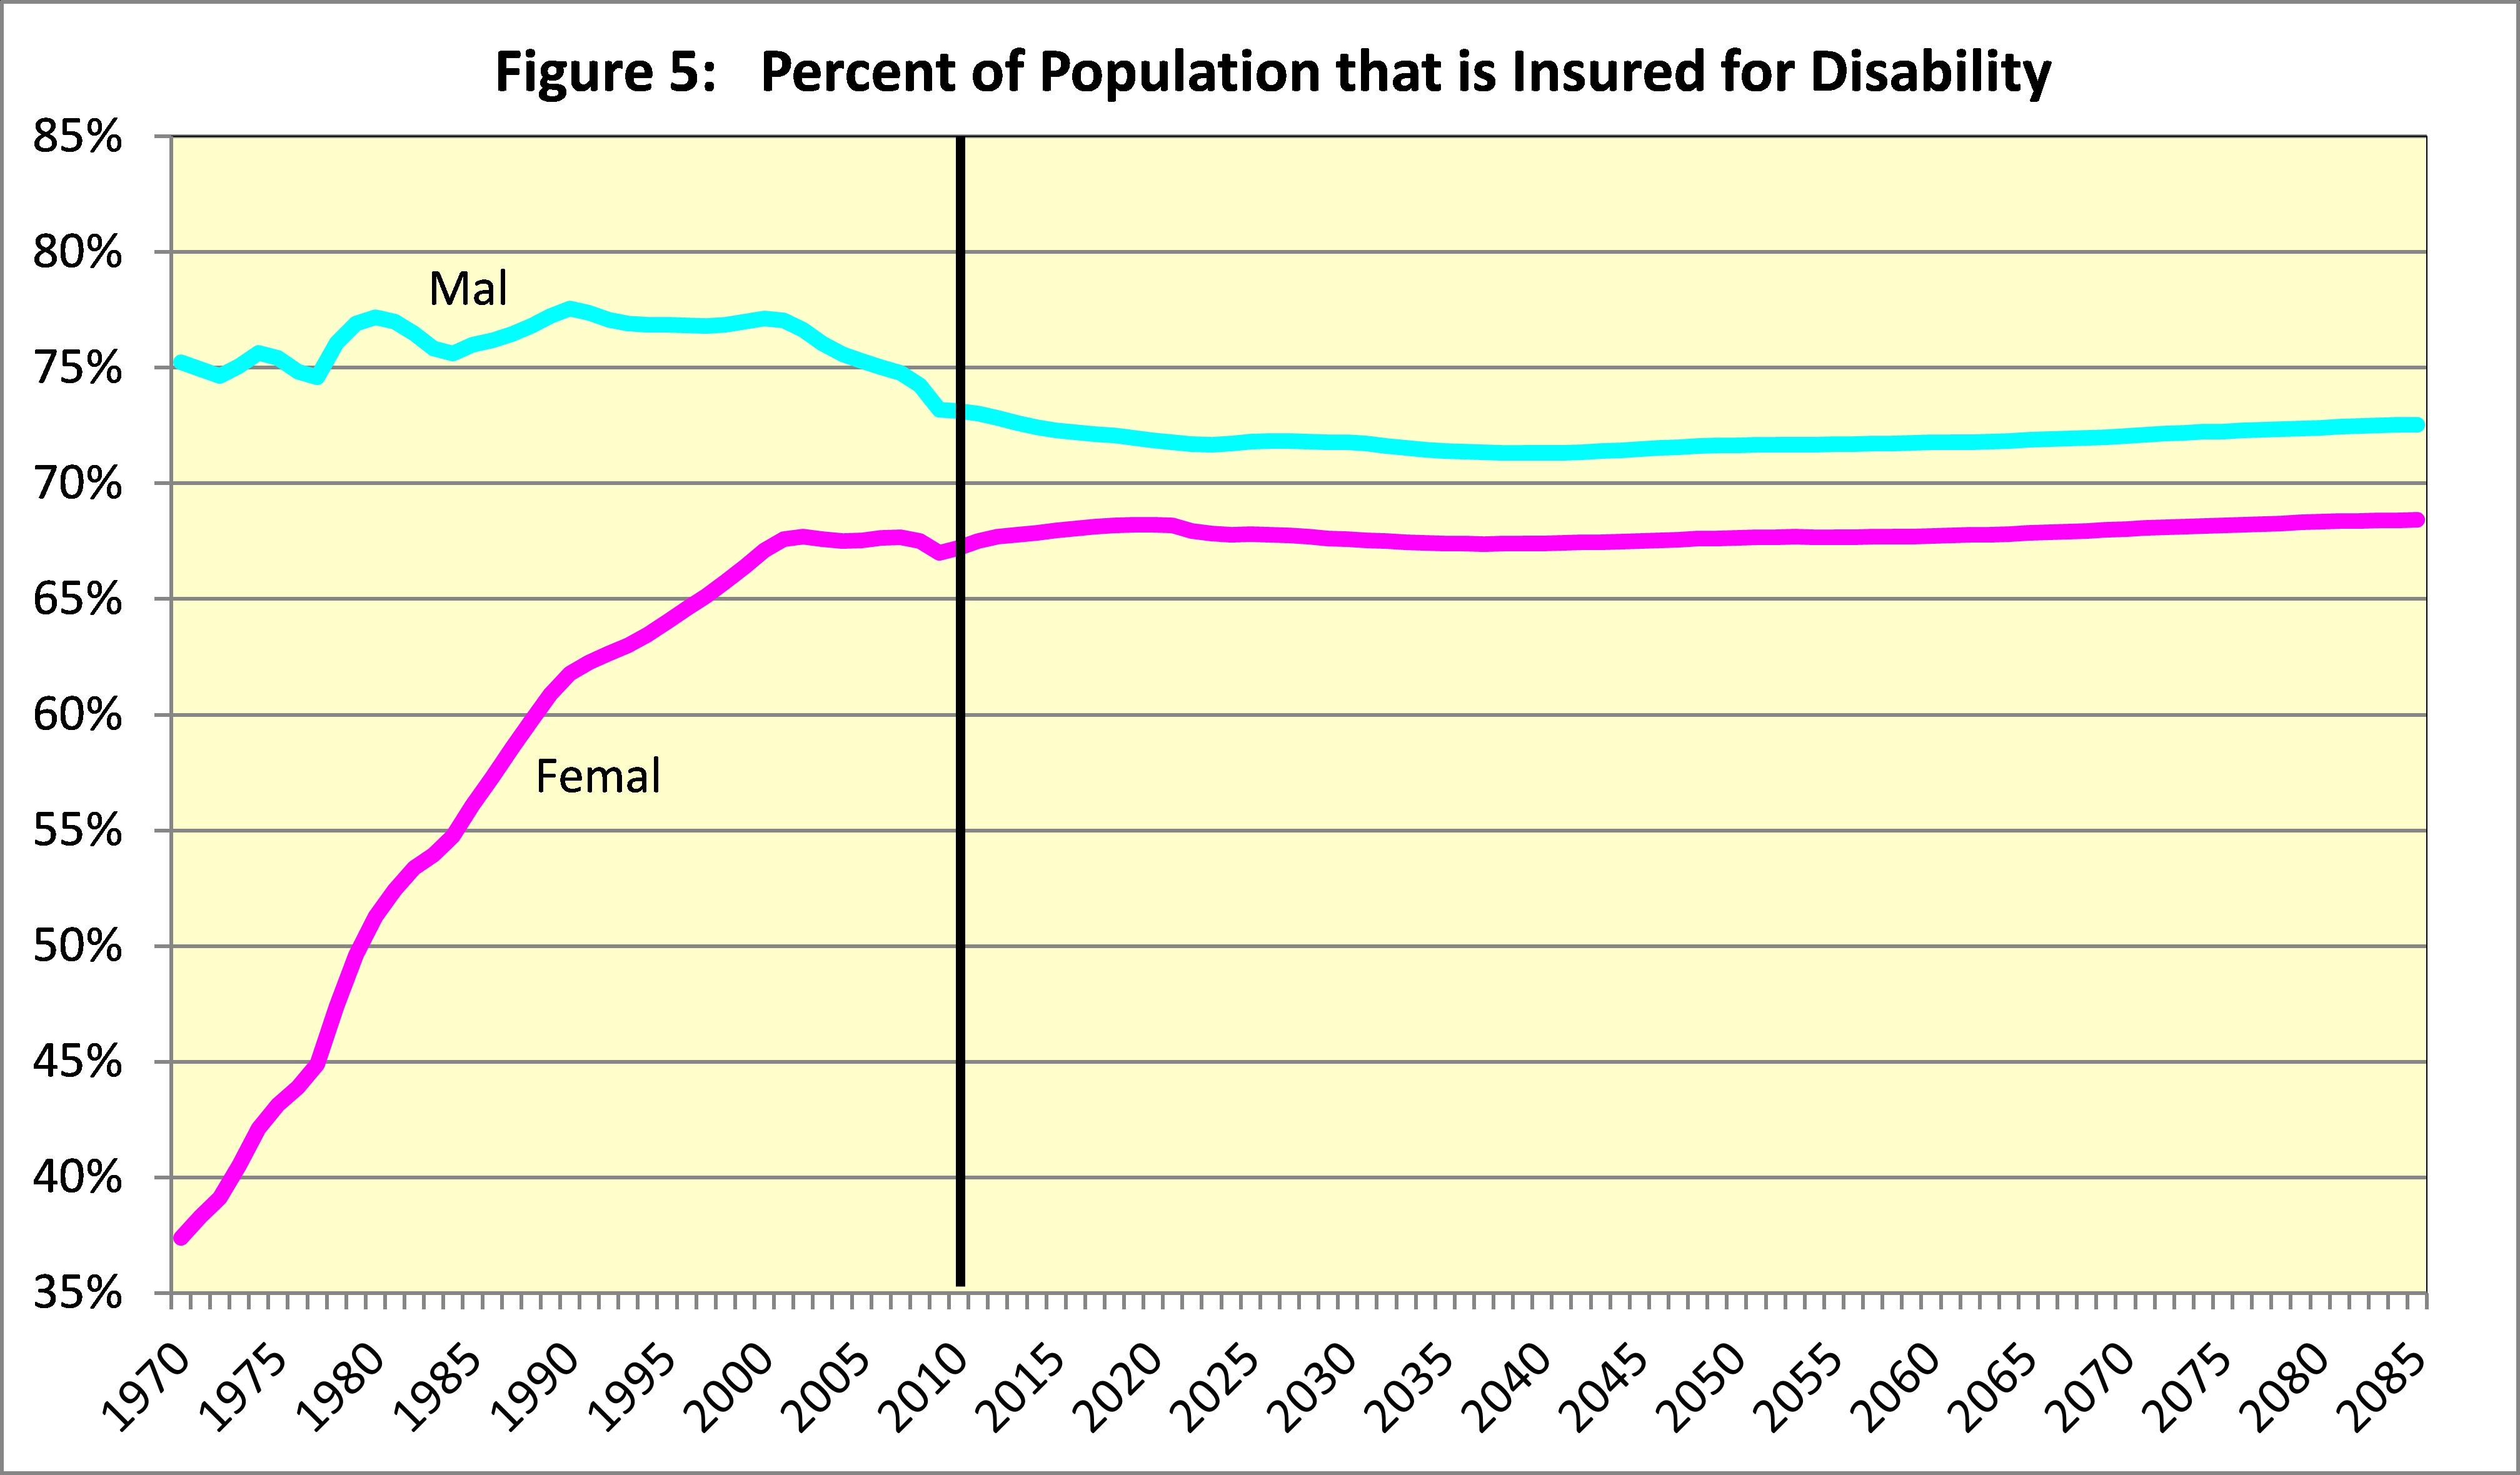
In the future, we project that men will be less likely to be insured, reflecting increased numbers of undocumented immigrants, and insured rates for women will stabilize close to those for men. These changes will slow the growth in the cost of the DI program.
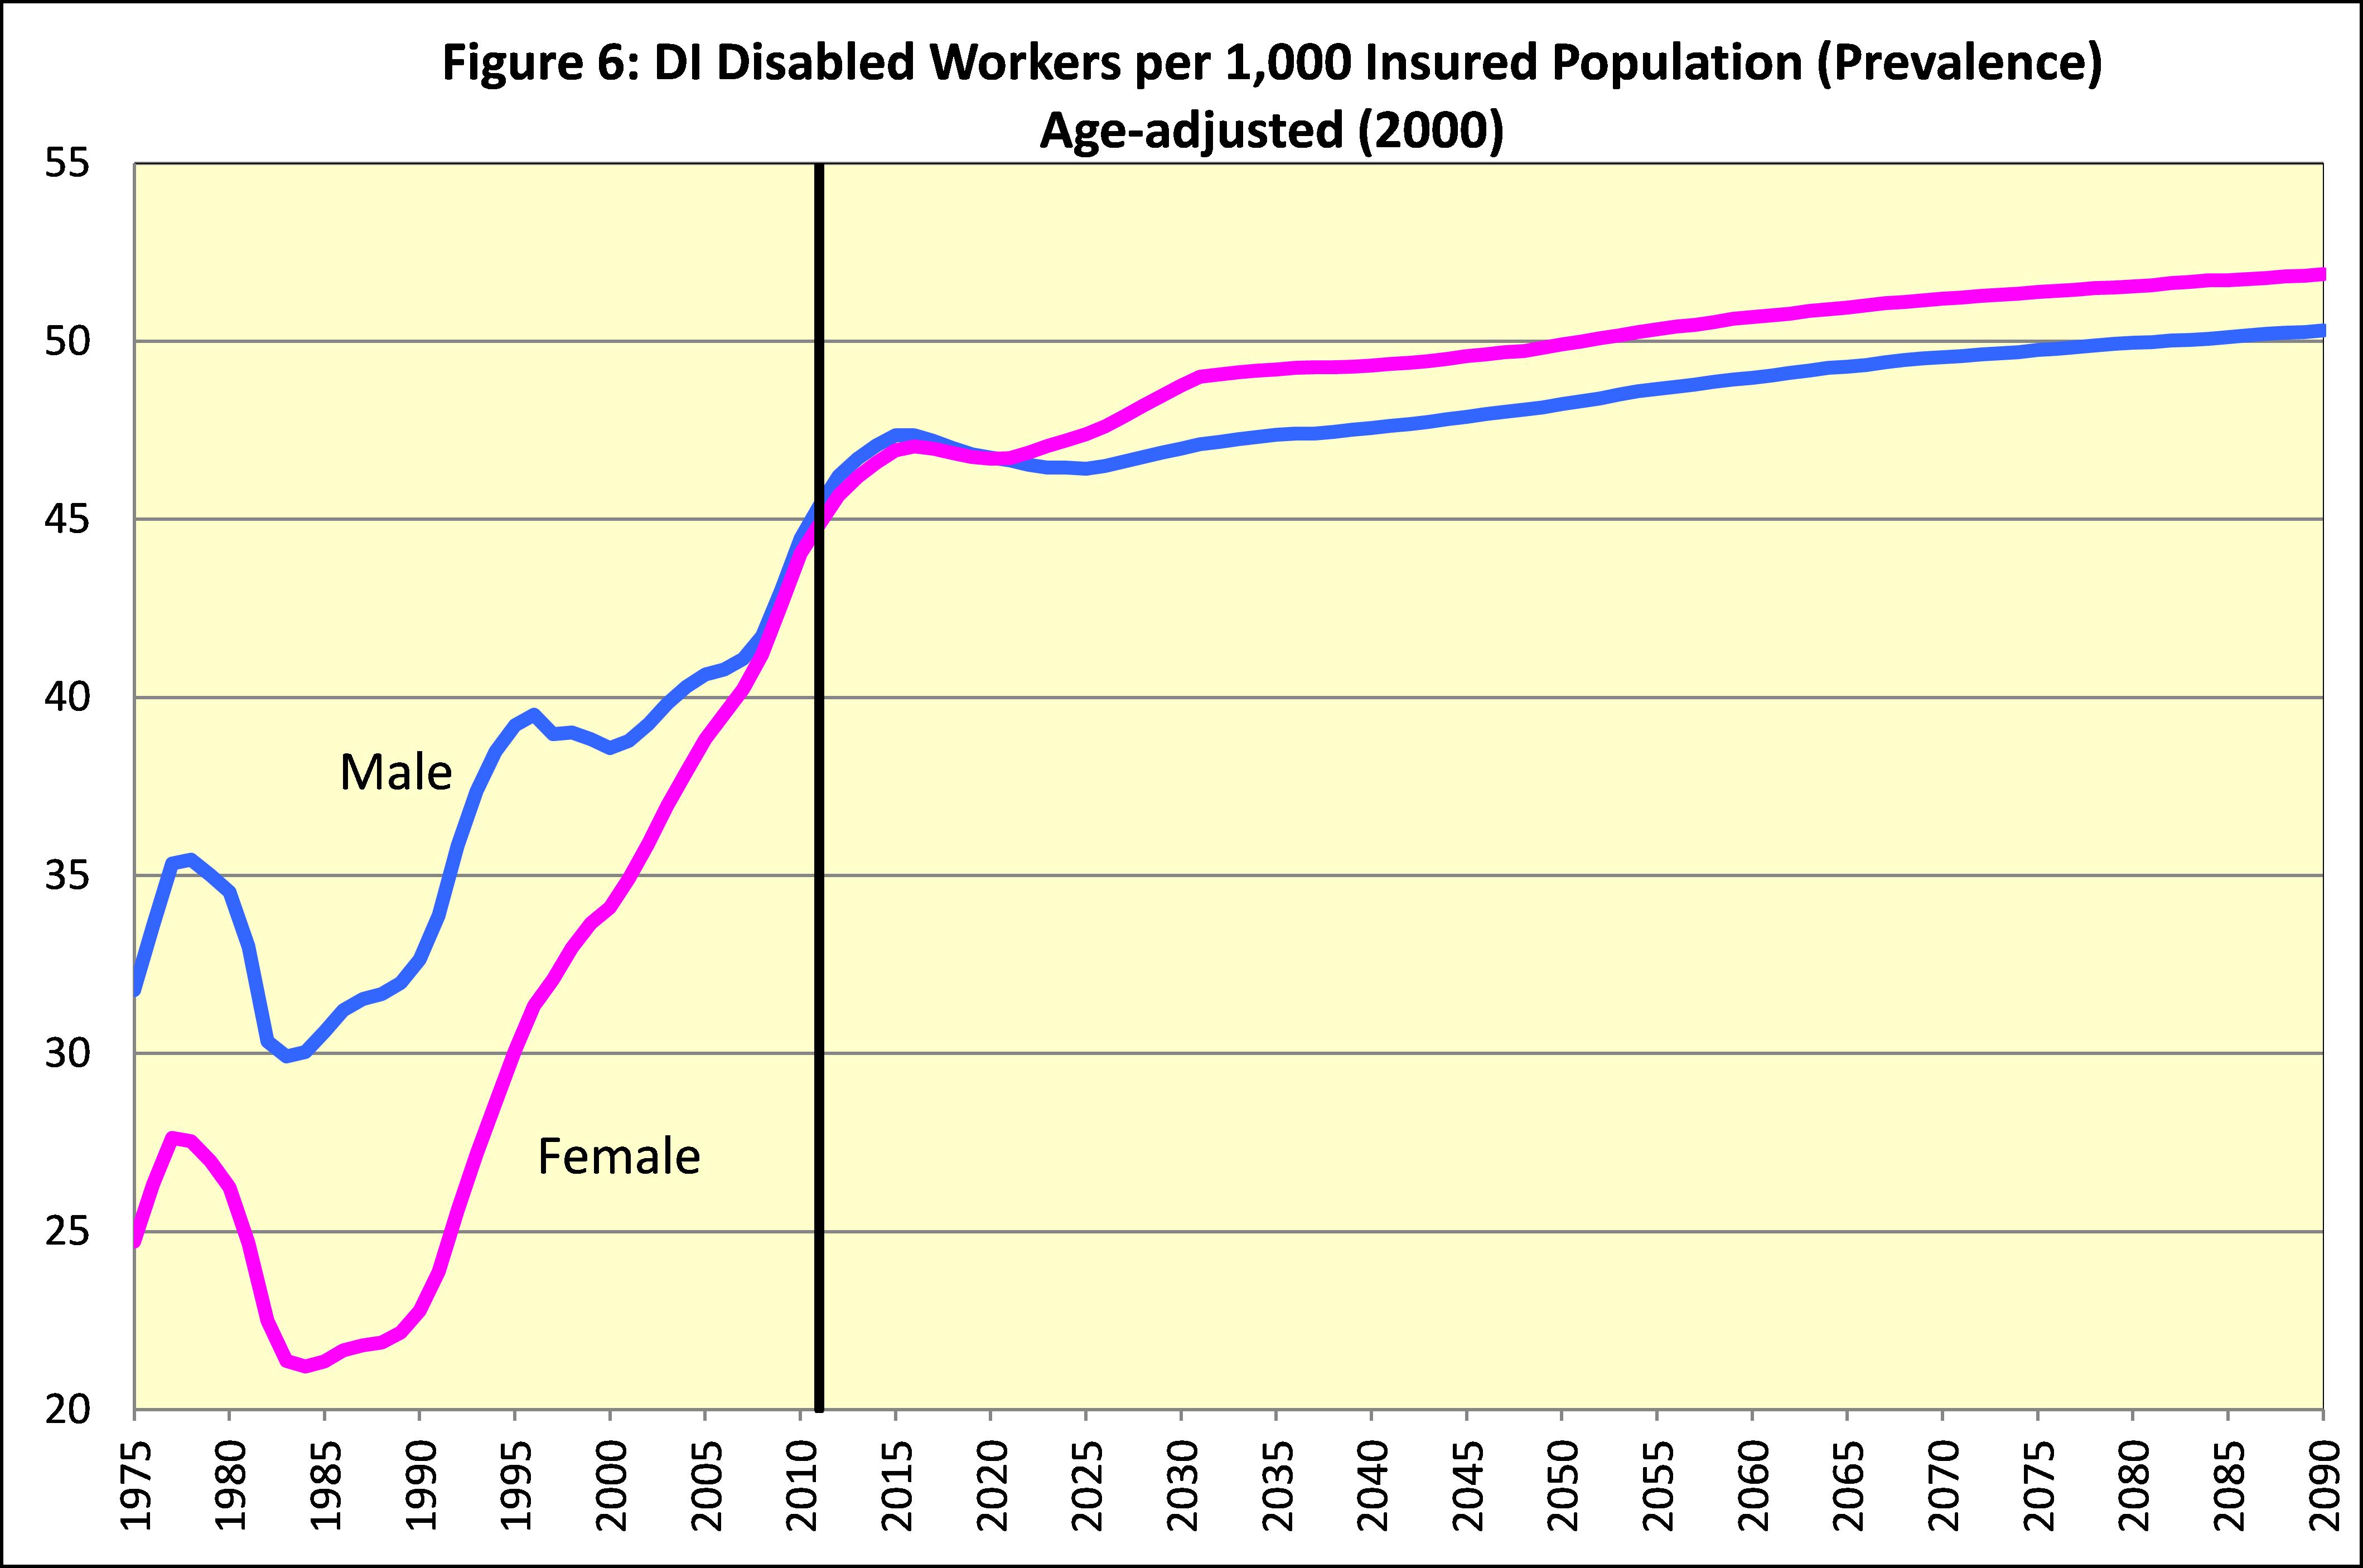
The fourth driver is the prevalence of disability among insured workers on an age-sex adjusted basis. This prevalence of disability rose from 31 percent of the insured population in 1980 to 44 percent in 2010, for a 42-percent increase.
The combined effects of these four drivers explain the overall 187-percent increase in the number of disabled worker beneficiaries between 1980 and 2010. The expected future stability in the ratio of workers to DI beneficiaries, and in the latter three factors, explains the projected future stability of DI program cost as a percent of GDP, and as a percent of taxable payroll.
(3) The Trustees’ Assumptions for Future Trends in Cost
Increased prevalence of disability reflects a number of factors, including changes in incidence rates, termination rates, and normal retirement age. The increase in incidence rates accounted for about half of the increase in the age-sex-adjusted prevalence rate between 1980 and 2010. The effect on prevalence was amplified because incidence rates have increased more at younger ages than at older ages. In 1980 the incidence for ages 25-44 was about 20 percent as large as the incidence rate at ages 45-64. By 2010 the incidence rate for ages 25-44 rose to 28 percent as high as the rate for ages 45-64.
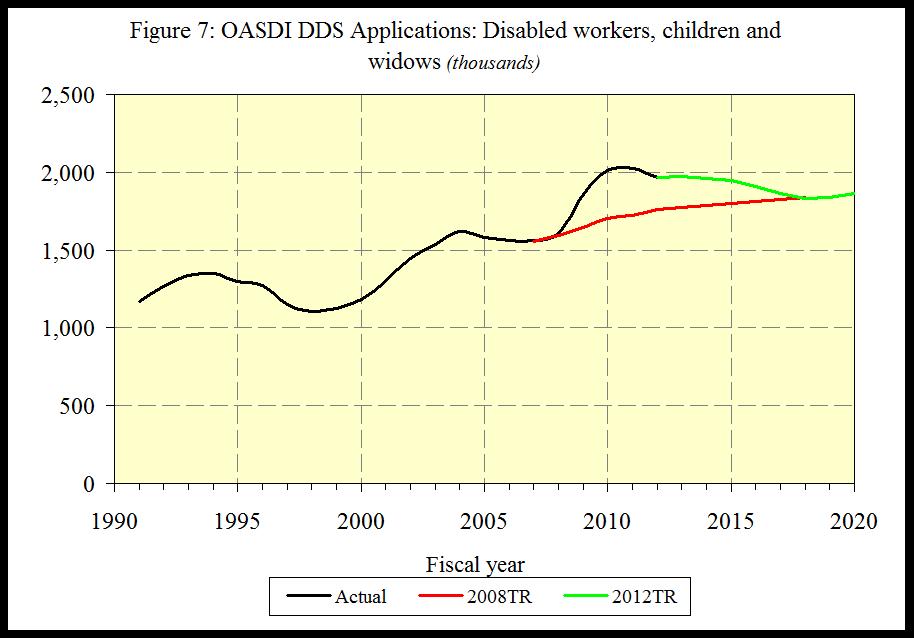
Incidence rates tend to increase temporarily in bad economic times. Some individuals who could readily qualify for DI benefits based on the severity of their medically-determinable impairment may be able to work at a level in excess of substantial gainful activity (SGA) given the opportunity and needed assistance. But with elevated unemployment rates like those seen over the last several years, many of these individuals will lose employment and will seek DI benefits. This effect can be seen in the elevated level of applications for disability benefits under the OASDI program starting in 2009, compared to the numbers expected for the 2008 Trustees Report, where no recession was anticipated.
Changes in the rate of disability incidence are most easily seen by excluding the effects of any change in the age distribution of the general population. For men, this age-adjusted incidence rate has averaged somewhat over five new disability awards per thousand exposed (insured but not already disabled) workers and has seldom been below this level. Since 1980, the age-adjusted incidence rate for women has increased to a level much closer to the rate for men.
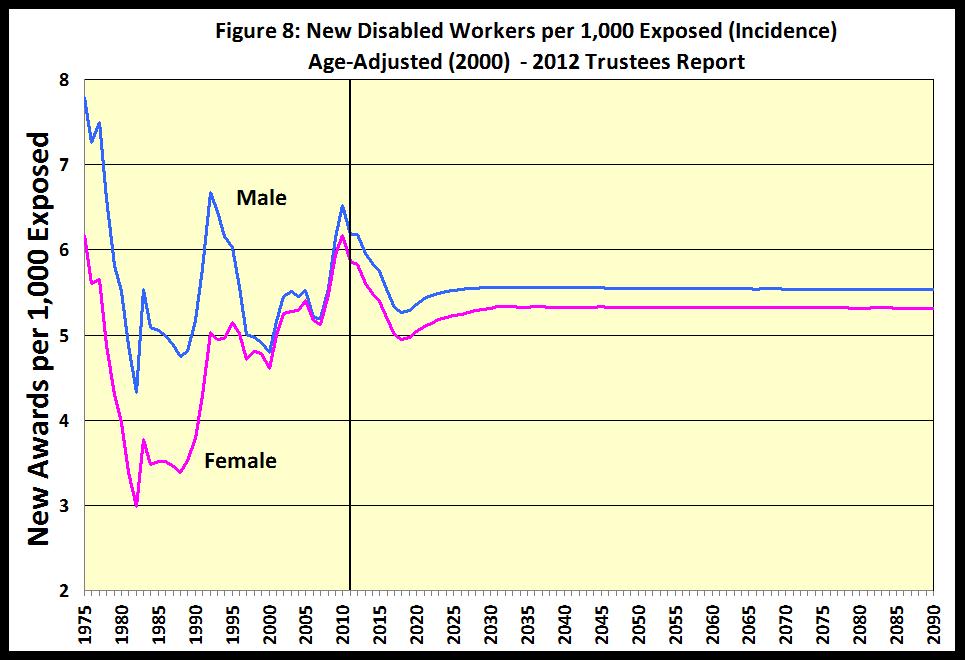
We expect that male and female age-adjusted disability incidence rates will be fairly stable in the future.
A more careful look at past fluctuations in the overall age-sex-adjusted disability incidence rate reveals a number of specific economic and policy drivers that have influenced DI program cost. Periodic economic recessions, as illustrated by the civilian unemployment rate in red in the figure below, have been associated with temporary increases in disability incidence.
Figure 9: Effects of Economic Cycles and Policy Changes on DI Incidence Rates
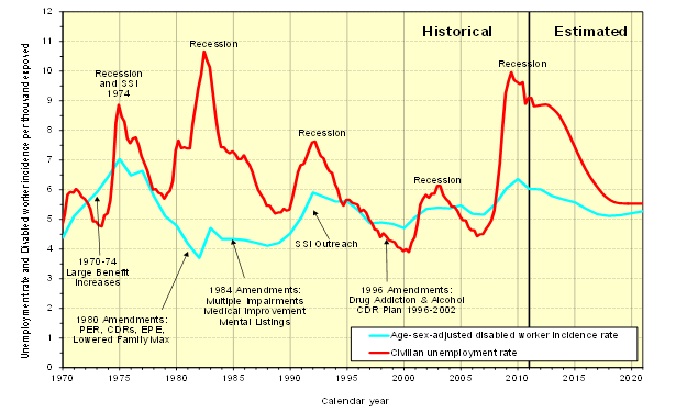
The very recent recession of 2008-2009 resulted in an increase in disability incidence to a peak level in 2010 that was exceeded only by the peak in 1975. One apparent exception to the relationship between disability incidence and economic recessions is the strong recession of 1981-1982. The effect of that recession appears to have been offset by the net effects of the 1980 Amendments, which: (1) sharply increased the levels of pre-effectuation review of disability allowances and continuing disability reviews of current beneficiaries; (2) introduced the extended period of eligibility to encourage work; and (3) lowered the maximum family benefit for DI beneficiaries.
Additional policy changes over the years had significant effects on disability incidence. Double-digit ad-hoc benefit increases in 1970 through 1974 made disability benefits more attractive. The 1984 Amendments may have countered the effects of a strong economic recovery with increased emphasis on multiple impairments and mental listings, and the requirement to show medical improvement for benefit cessation. The SSI outreach to disabled adults likely added to the effects of the 1990-1991 recession. Also, the effects of a strong economic recovery from 1995 to 2000 on lowering incidence rates may have been enhanced by the 1996 Amendments which eliminated drug addiction and alcoholism as disabling impairments. Future policy changes and economic cycles will undoubtedly continue to cause fluctuations in disability incidence rates.
Disability incidence rates tell us the rate at which insured individuals with recent work experience file for and are awarded disabled worker benefits. The cost of providing benefits to disabled workers also depends on how long their disability lasts. Currently, about 3.5 percent of disabled workers die or recover from medical improvement or demonstrated ability to return to work each year. Most of these disability terminations are from death. Only about one in four of the terminations results from medical improvement or return to work.
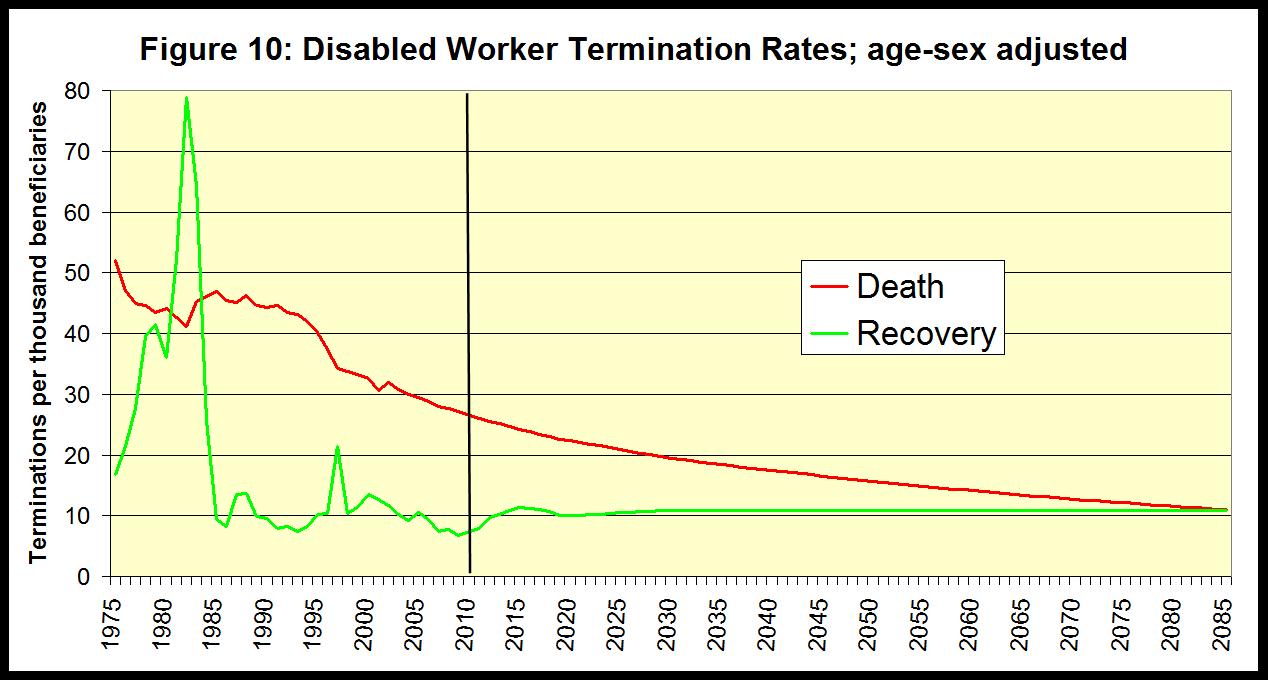
For the future, we project that death rates for disabled workers will decline at about the same rate as for the general population, at each age. We assume that future rates of medical and work recovery termination will be fairly stable in the future, at about one percent of the beneficiary population each year.
(4) Changes in the Distribution of Disabled Workers by Age and Medical Diagnosis
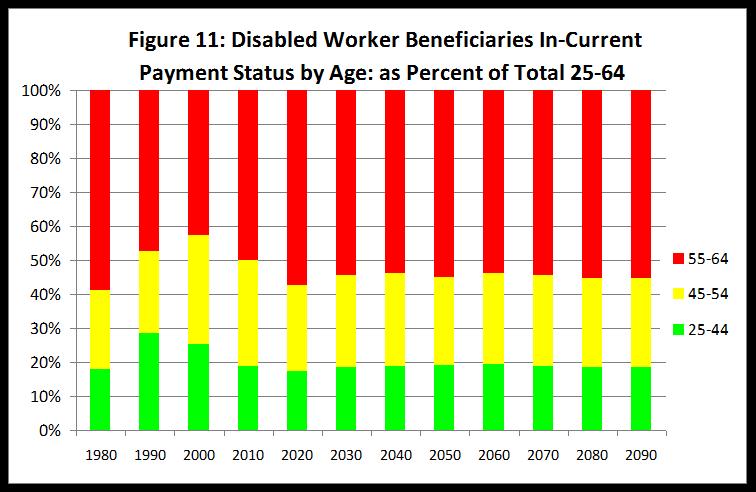
The changing age distribution of the population at ages 20-64 and changes in age-specific disability incidence rates have resulted in a substantial change in the age distribution of the disabled worker population. Disabled worker beneficiaries under age 45 accounted for 18 percent of the total in 1980, but accounted for 28 percent by 1990 as the baby boom generation reached ages 25-44 in 1990. Over the next 20 years, from 1990 to 2010, the aging of the baby-boom generation caused the share of disabled workers under age 45 to decrease substantially back to about 19 percent of the total. This shift in age distribution for both the general population and the disabled worker population will be permanent in the future due to persistent lower birth rates. The percent of disabled worker beneficiaries that is under age 45 would have declined even further by 2010 but for the relatively greater increases in incidence rates at younger ages between 1980 and 2010.
We expect that the distribution of the disabled worker population by medical diagnosis code at award will change in the future because:
- The increased numbers of younger awards are more likely to have mental impairments, and are likely to persist to higher ages. (Mental impairment is the primary diagnosis for 40 percent of new entitlements at ages 30-39, but only 10 percent for new entitlements at ages 50-59.)
- The percent of older new entitlements with musculoskeletal primary diagnosis has risen substantially from about 20 percent in 1985 to over 30 percent by 2010.
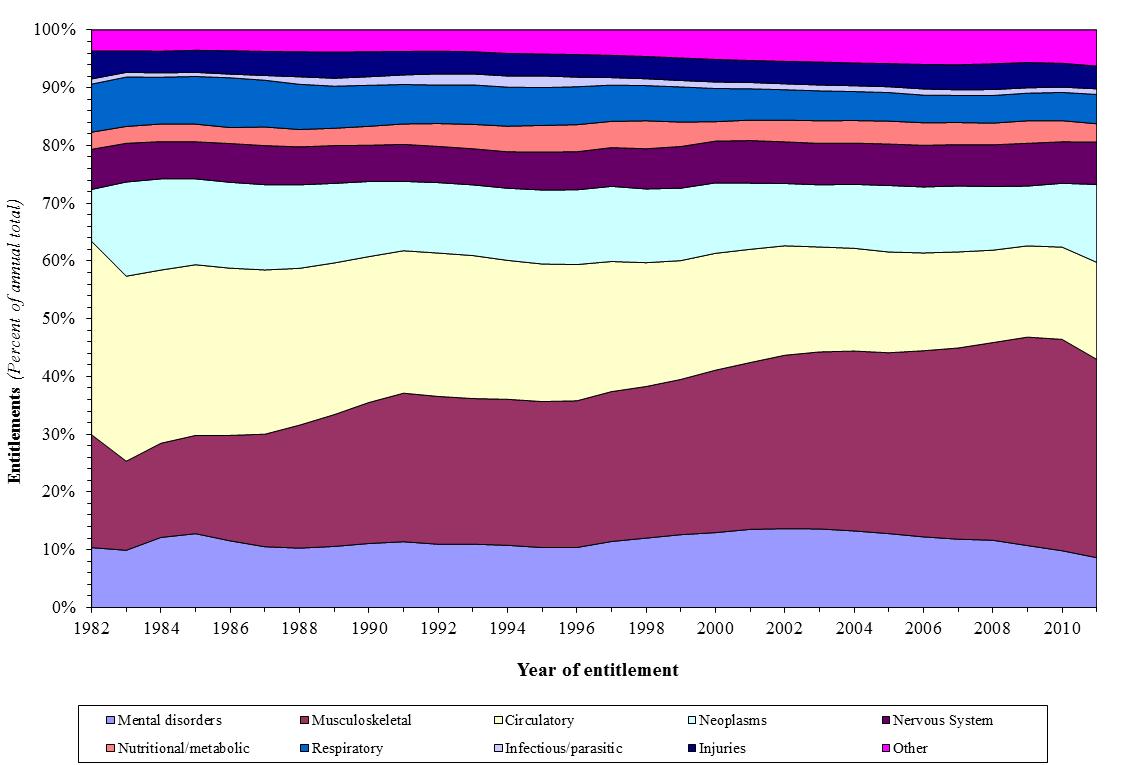
Figures 12 and 13 below show that the distributions by diagnosis have remained very stable for male and female new entitlements at ages 30-39. Thus, the relative increase in young-age incidence rates is not the result of change specific to just one or two diagnoses. Note that the distributions for new entitlements for 2010 and 2011 are somewhat distorted because awards for some diagnoses tend to take longer to adjudicate to completion.
Figure 12: Female Age 30-39 disabled worker new entitlement distribution by primary diagnosis (awarded through June 2012)
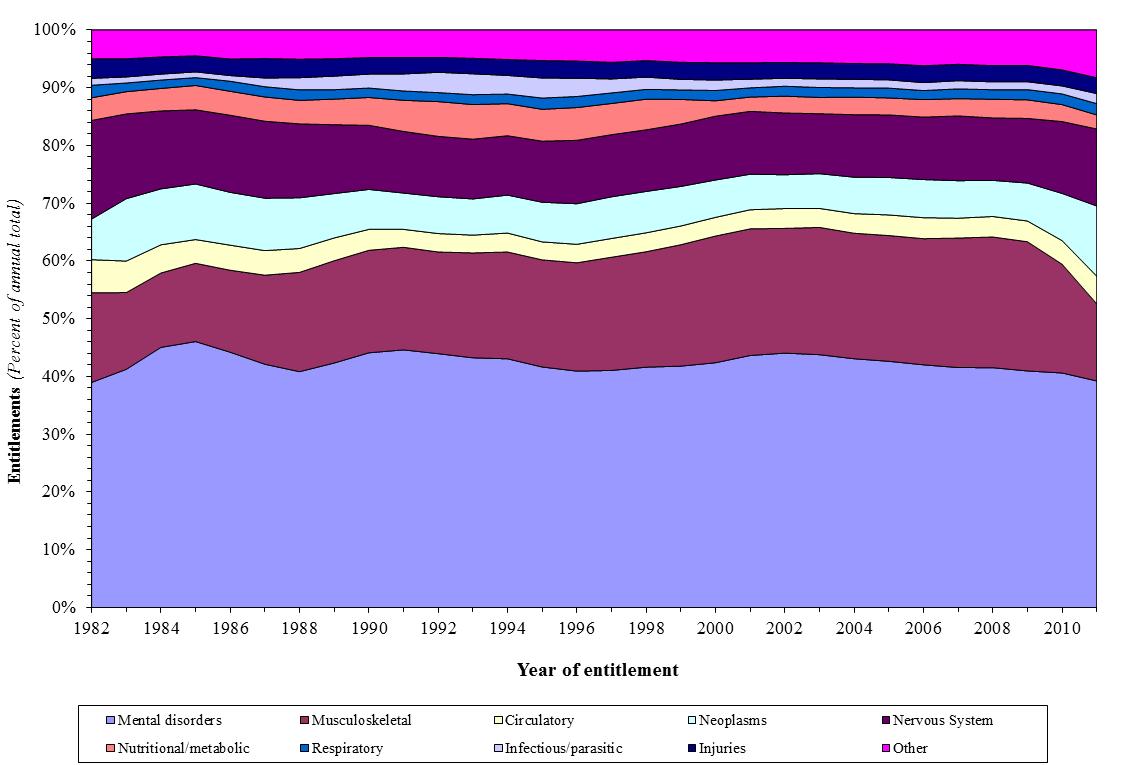
Figure 13: Male Age 30-39 disabled worker new entitlement distribution by primary diagnosis (awarded through June 2012)
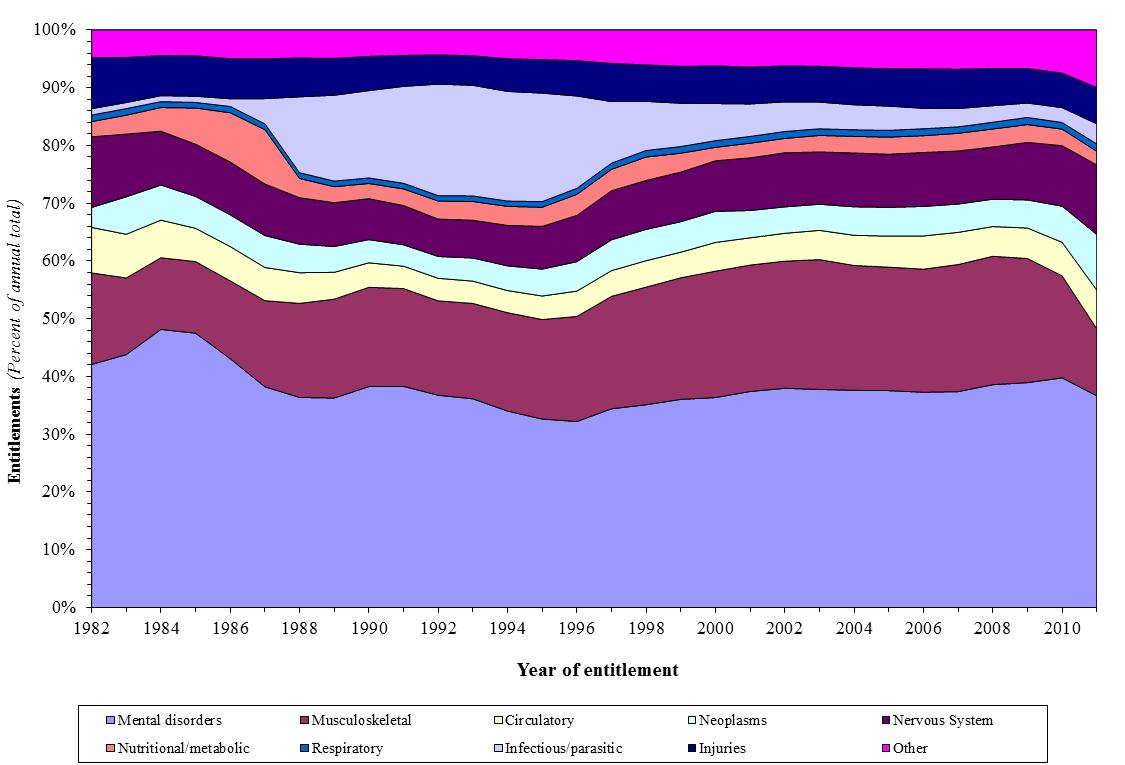
Figures 14 and 15 show that at higher ages, increases in musculoskeletal diagnoses and decreases in circulatory diagnoses are the primary changes over the last 30 years.
Figure 14: Female Age 50-59 disabled worker new entitlement distribution by primary diagnosis (awarded through June 2012)
Figure 15: Male Age 50-59 disabled worker new entitlement distribution by primary diagnosis (awarded through June 2012)
(5) Past and Projected Numbers of Full Medical Continuing Disability Reviews (CDRs)
Benefits are terminated for about 1 percent of disabled worker beneficiaries each year due in roughly equal shares to medical recovery and return to work. Beneficiaries are subject to periodic medical CDRs at varying durations depending on the expected likelihood of medical recovery. Beneficiaries who are profiled to be most likely to have recovered are subject to full medical reviews (FMRs), with others sent mailer questionnaires to assess their progress.
The figure below illustrates in the blue bars the total numbers of full medical reviews (for both OASDI and SSI beneficiaries) completed in years 1996 through 2012 with the level of funding appropriated for such reviews shown in the green line. The red line for years 1996 through 2002 shows the level of funding that was authorized in P.L. 104-121 in order to allow SSA to work down a backlog of CDRs that had developed through 1995. Actual appropriations were adjusted to less than authorized in years 1997 to 2002 based on SSA’s revised assessment of funding needs to eliminate the backlog by 2002. Dollar amounts authorized and appropriated for each year are all average-wage indexed to 2013 level in order to provide rough comparability in staffing potential for appropriations across the years.
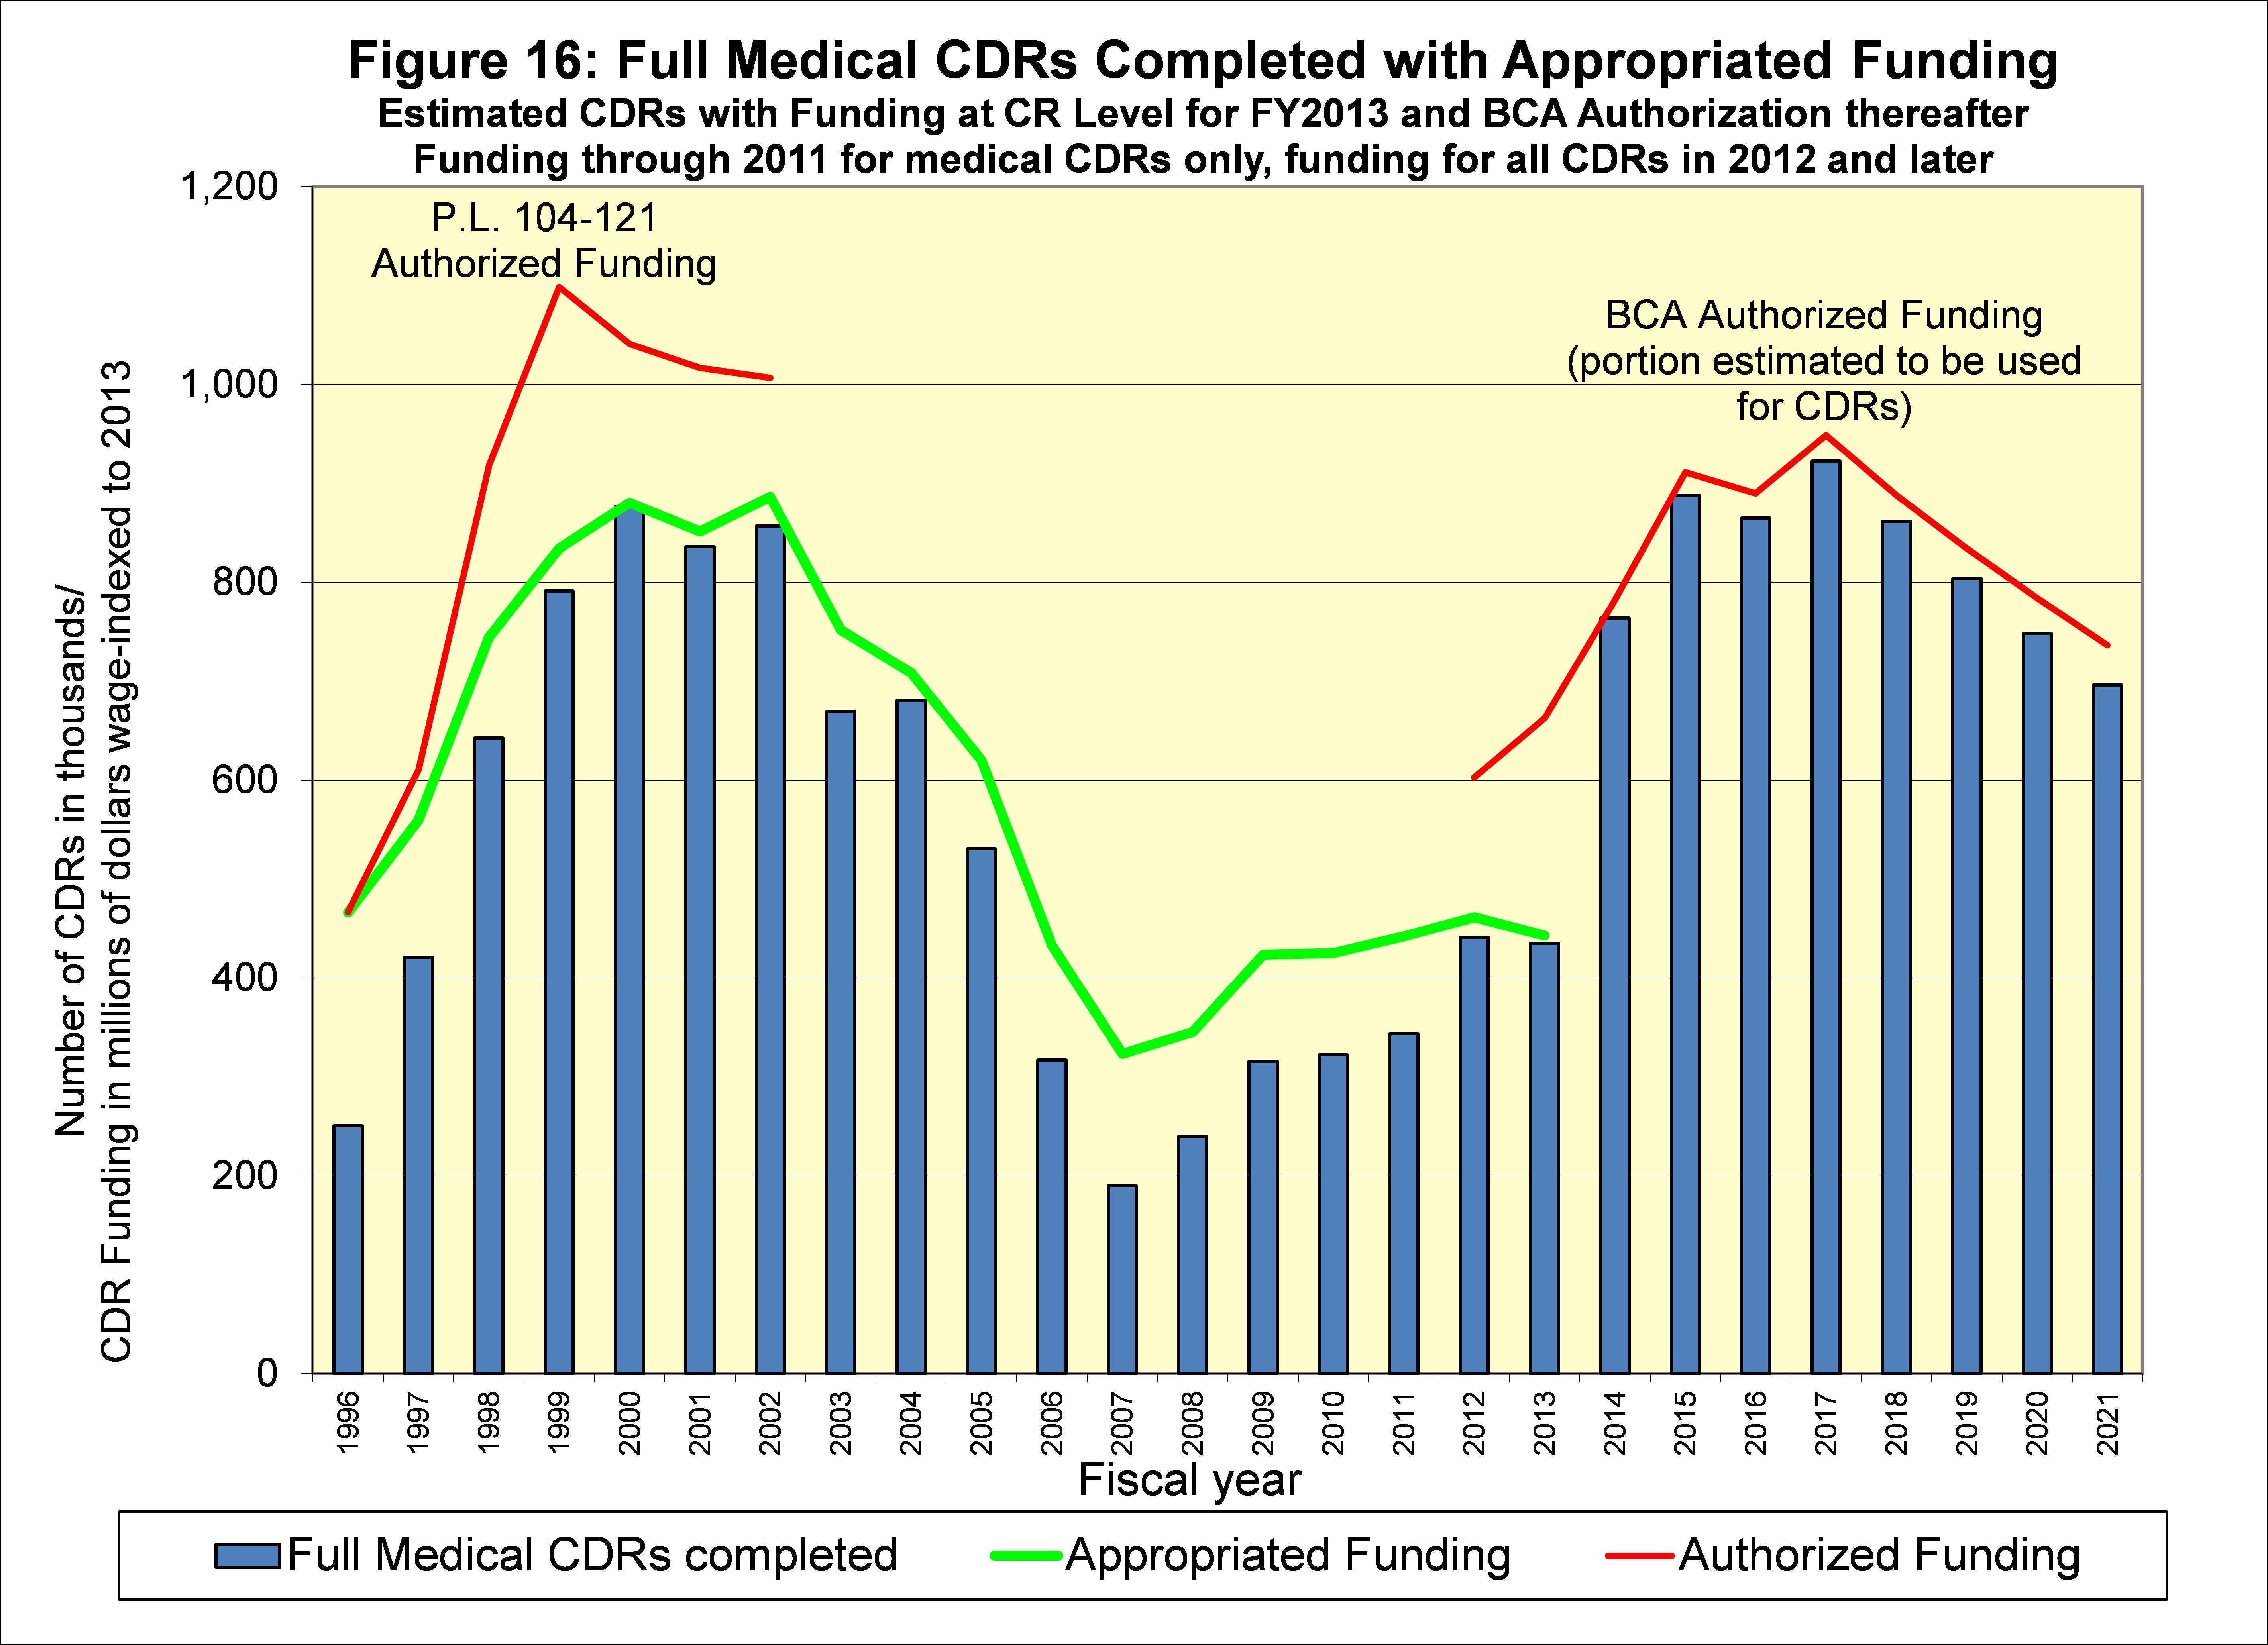
With the CDR backlog eliminated in 2002 and authorized funding under P.L. 104-121 expired, annual appropriations slipped to lower levels through 2011 and the CDR backlog returned. Funding authorized for medical CDRs, work CDRs, and SSI non-medical redeterminations in the Budget Control Act of 2011 was intended to eliminate the medical CDR backlog for OASDI within 10 years. The portion of the BCA-authorized funding estimated to be attributable to CDRs is shown in the figure in red for years 2012 through 2021.
However, annual appropriations fell below the amount authorized in BCA for 2012, and are expected to be well below the BCA level for 2013. The FMR CDRs indicated in the blue bars for 2012 and 2013 reflect the reduced appropriation in 2012, and assume that the appropriation for 2013 will be at the Continuing Resolution level for the full year.
FMR CDRs shown in blue bars for years 2014 through 2021 assume that the full BCA-authorized funding for those years will be appropriated. If less than this level of funding is appropriated in 2014-2021, then SSA is not expected to be able to eliminate the CDR backlog as intended in the law.
Conclusion
Demographic changes, principally the drop in the birth rate after the baby boom, have dramatically changed the age distribution of the population. This change has increased the cost of the DI program as a percent of taxable payroll (and as a percent of GDP) over the past 20 years in much the same way that it will raise OASI and Medicare costs over the next 20 years. Disability insured rates and incidence rates have increased substantially for women, further contributing to higher DI cost. However, all of these trends have stabilized or are expected to do so in the future.
We project that the number of DI beneficiaries will continue to increase in the future, but only at about the rate of increase in workers. Thus, the current shortfall in tax income compared to DI program cost is projected to be stable in the future. Restoring sustainable solvency for the DI program requires about a 16-percent reduction in benefits, a 20-percent increase in revenue, or some combination of these changes. Similar changes are needed for the OASI program.
We have analyzed and “scored” numerous Congressional provisions that would make such changes to the OASDI program. These analyses are available at http://www.ssa.gov/oact/solvency/provisions/index.html. In addition, our estimates for the effects of provisions specific to DI can be found in our July 18, 2011 letter to Senator Coburn at http://www.ssa.gov/cgi-bin/solvency.cgi. Even if such changes are not effected soon, a modest reallocation of the total OASDI payroll tax can be enacted prior to 2016 that would equalize the actuarial status of the OASI and DI programs, allowing both programs to pay full scheduled benefits until 2033.