U.S. Social Security Administration, Office of Retirement and Disability Policy.
Annual Statistical Report on the Social Security Disability Insurance Program, 2009
 

Benefits Awarded, Withheld, and Terminated

Awards to Disabled Beneficiaries and Nondisabled Dependents

Awards to All Disabled Beneficiaries

Awards to Disabled Workers

Awards to Disabled-Worker Families

Benefits Withheld from All Disabled Beneficiaries

Benefits Terminated for All Disabled Beneficiaries

Disabled Workers Who Work

Reinstatement Status for Disabled Workers


Benefits Awarded, Withheld, and Terminated
Chart 8.
Social Security disability awards, 1980–2009

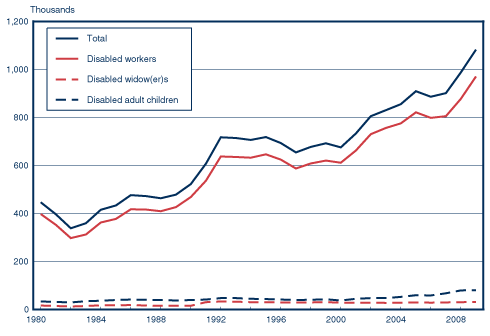
The total number of awards decreased from 1980 through 1982, started to rise in 1983, and began to increase more rapidly in 1990. Awards for disabled-worker benefits have been most pronounced and drive the overall pattern shown in the total line. They increased from a low of 297,131 in 1982 to 636,637 in 1992, were relatively flat from 1992 through 2000, and started to increase again in 2001. There were 970,696 worker awards in 2009. Other awards have risen at a much slower rate. Awards to disabled adult children have gradually increased from 33,470 in 1980 to 79,769 in 2009. Awards to disabled widow(er)s have risen from just over 16,000 in 1980 to 31,518 in 2009.

Social Security disability awards - line chart linked to text description.
SOURCE: Table 35.
Top of page. Table of contents.
Benefits Awarded, Withheld, and Terminated
Chart 9.
Average monthly benefit awards, by sex, 2009

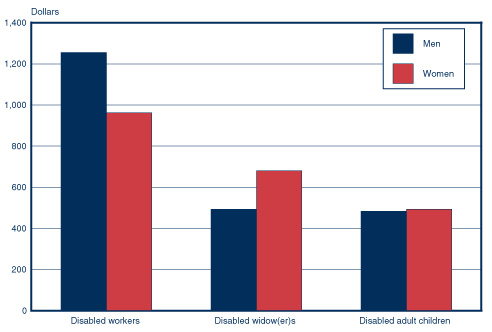
The average monthly benefit awarded to disabled workers is higher than that awarded to disabled widow(er)s or disabled adult children. The reason for the difference is that disabled workers receive 100 percent of the primary insurance amount, compared with 71.5 percent for disabled widow(er)s and 50 percent for disabled adult children (if the worker is disabled or retired) or 75 percent (if the worker is deceased).

Because men have traditionally had higher earnings than women, their monthly benefit is higher. This is most obvious in the disabled-worker group. Benefits for disabled widow(er)s and disabled adult children are dependents' benefits, so their monthly benefit is a function of the worker's earnings. Therefore, a disabled widow's average benefit tends to be higher than that of a disabled widower because a male worker's earnings are higher than a female worker's. Benefit amounts are about the same for men and women in the disabled adult children group.

Average monthly benefit awards, by sex, 2008 - bar chart linked to text description.
SOURCE: Table 36.
Top of page. Table of contents.
Benefits Awarded, Withheld, and Terminated
Chart 10.
Disabled-worker awards, by selected diagnostic group, 2009

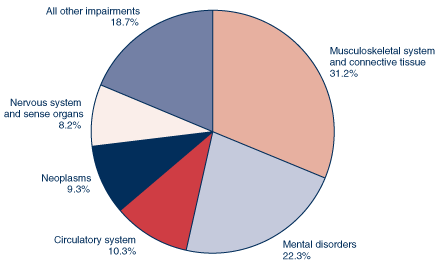
In 2009, 970,696 disabled workers were awarded benefits. Among those awardees, the most common impairment was diseases of the musculoskeletal system and connective tissue (31.2 percent), followed by mental disorders (22.3 percent), circulatory problems (10.3 percent), neoplasms (9.3 percent), and diseases of the nervous system and sense organs (8.2 percent). The remaining 18.7 percent of awardees had other impairments.

Disabled-worker awards, by selected diagnostic group, 2008 - pie chart linked to text description.
SOURCE: Table 37.
Top of page. Table of contents.
Awards to Disabled Beneficiaries and Nondisabled Dependents
Table 35.
Number, selected years 1960–2009
Year Total Workers and nondisabled dependents Widow(er)s Adult children of—
Workers Spouses Children
under
age 18
Students
aged
18–19
Disabled
workers
Retired
workers
Deceased
workers
1960 388,861 207,805 54,187 102,516 . . . . . . 1,794 12,740 9,819
1965 538,983 253,499 69,183 175,109 19,794 . . . 2,713 10,017 8,668
1970 799,616 350,384 96,304 241,627 71,145 15,609 3,774 11,348 9,425
1975 1,305,345 592,049 148,741 391,284 117,043 23,521 6,889 14,636 11,182
1980 933,597 396,559 108,500 235,079 143,935 16,054 6,194 16,650 10,626
1981 826,340 351,847 95,575 199,829 134,390 14,154 5,435 15,365 9,745
1982 672,333 297,131 77,835 153,205 103,015 12,440 4,250 14,772 9,685
1983 661,467 311,549 80,079 152,954 68,834 14,412 5,107 17,309 11,223
1984 730,135 361,998 81,834 172,721 59,990 17,165 5,541 18,330 12,556
1985 763,363 377,371 83,511 190,204 56,108 17,086 6,713 19,661 12,709
1986 809,424 416,865 82,435 198,192 52,989 18,418 6,986 20,295 13,244
1987 799,180 415,848 77,316 195,030 54,925 16,396 6,787 20,761 12,117
1988 795,690 409,490 73,790 196,655 61,725 15,328 6,646 20,544 11,512
1989 801,893 425,582 69,113 197,950 57,079 15,168 6,358 19,668 10,975
1990 868,793 467,977 69,667 218,059 58,894 15,424 6,633 20,862 11,277
1991 990,500 536,434 72,754 250,287 60,349 29,590 7,552 21,850 11,684
1992 1,167,001 636,637 78,083 306,002 66,035 33,235 9,548 23,615 13,846
1993 1,177,268 635,238 74,605 317,263 71,081 31,835 10,254 23,173 13,819
1994 1,177,236 631,870 69,549 327,067 74,364 29,903 9,774 22,119 12,590
1995 1,173,317 645,832 63,097 315,587 75,929 29,597 9,779 21,566 11,930
1996 1,139,054 624,335 57,528 311,228 76,769 28,611 9,353 20,169 11,061
1997 1,059,556 587,417 50,818 278,040 76,034 28,546 8,474 19,611 10,616
1998 1,087,352 608,131 47,550 279,764 82,567 29,399 9,095 19,932 10,914
1999 1,106,343 620,488 46,164 283,768 84,525 29,650 9,851 20,467 11,430
2000 1,051,900 610,700 38,500 263,200 74,600 27,600 7,000 21,100 9,200
2001 1,118,300 661,900 41,100 268,800 75,700 26,500 9,800 22,300 12,200
2002 1,219,670 730,383 43,301 293,131 77,927 28,339 8,507 22,798 15,284
2003 1,259,672 755,706 44,638 302,756 82,447 27,324 9,740 21,836 15,225
2004 1,311,031 775,244 45,649 313,640 96,871 27,744 13,301 22,127 16,455
2005 1,402,509 821,207 49,917 338,506 104,405 29,576 15,334 25,591 17,973
2006 1,369,044 798,675 49,521 325,861 107,786 28,682 15,373 25,679 17,467
2007 1,383,199 804,787 47,583 322,362 112,140 28,810 18,790 28,359 20,368
2008 1,506,563 877,226 50,756 348,649 119,633 30,605 22,613 32,712 24,369
2009 1,647,013 970,696 54,112 381,786 129,132 31,518 21,214 35,734 22,821
SOURCES: Social Security Administration. For years before 2000, Annual Statistical Supplement to the Social Security Bulletin, based on the Master Beneficiary Record, various sampling rates; from 2000 to 2001, Annual Award and Termination Transaction file, 1 percent sample; data after 2001 are 100 percent data.
NOTES: Data exclude closed period awards in 2002 and 2003 and expedited reinstatement cases since 2002.
. . . = not applicable.
CONTACT: Hazel P. Jenkins (410) 965-0164 or di.asr@ssa.gov.
Top of page. Table of contents.
Awards to Disabled Beneficiaries and Nondisabled Dependents
Table 36.
Average monthly benefit, by basis of entitlement, age, and sex, 2009
Basis of entitlement and age Total Male Female
Number Average
monthly
benefit a
(dollars)
Number Average
monthly
benefit a
(dollars)
Number Average
monthly
benefit a
(dollars)
Workers
Total 970,696 1,119.90 521,424 1,255.00 449,272 963.10
Under 25 41,927 585.10 24,604 599.10 17,323 565.20
25–29 37,512 806.90 19,638 831.90 17,874 779.40
30–34 44,143 905.20 21,984 947.60 22,159 863.20
35–39 63,820 967.30 31,797 1,039.60 32,023 895.50
40–44 92,626 1,021.50 46,521 1,123.10 46,105 918.90
45–49 129,397 1,089.30 65,353 1,214.10 64,044 962.00
50–54 191,302 1,157.60 99,731 1,306.70 91,571 995.30
55–59 220,879 1,253.40 123,124 1,421.60 97,755 1,041.50
60–64 143,469 1,321.10 85,037 1,497.30 58,432 1,064.70
65–FRA 5,621 1,276.30 3,635 1,415.50 1,986 1,021.40
Spouses of disabled workers
Total 54,112 293.00 3,169 224.20 50,943 297.20
Entitlement based on care of children 18,024 211.10 1,062 169.60 16,962 213.70
Under 30 3,028 145.10 90 125.70 2,938 145.70
30–34 2,916 164.90 146 122.80 2,770 167.10
35–39 3,579 191.30 210 148.20 3,369 194.00
40–44 3,336 228.50 205 179.30 3,131 231.70
45–49 2,711 255.30 209 184.80 2,502 261.20
50–54 1,561 289.80 119 210.80 1,442 296.40
55–FRA 893 328.10 83 232.60 810 337.90
Entitlement based on age 36,088 333.90 2,107 251.70 33,981 339.00
62–64 31,439 326.10 1,278 226.60 30,161 330.30
65 or older 4,649 386.50 829 290.30 3,820 407.30
Children of disabled workers
Total 532,132 292.30 274,962 294.10 257,170 290.30
Under age 18 381,786 256.20 187,647 256.20 194,139 256.30
Under 5 95,078 198.60 46,531 199.30 48,547 198.00
5–9 93,868 227.90 46,161 228.60 47,707 227.30
10–14 124,452 278.00 61,289 277.00 63,163 279.00
15–17 68,388 335.70 33,666 335.20 34,722 336.10
Students aged 18–19 129,132 393.40 68,440 395.70 60,692 390.80
Disabled aged 18 or older 21,214 325.20 12,383 325.80 8,831 324.50
Widow(er)s
Total 31,518 666.30 2,344 494.20 29,174 680.10
50–54 15,530 661.20 1,059 481.30 14,471 674.40
55–59 15,762 669.70 1,268 503.40 14,494 684.20
60–FRA 225 777.20 17 618.80 208 790.20
Adult children
Total 79,769 487.90 45,821 483.60 33,948 493.80
Children of—
Disabled workers 21,214 325.20 12,383 325.80 8,831 324.50
Retired workers 35,734 476.90 20,296 470.50 15,438 485.40
Deceased workers 22,821 656.30 13,142 652.40 9,679 661.70
Under 25 40,387 478.30 23,646 479.20 16,741 477.00
25–29 11,094 513.20 6,329 505.00 4,765 524.00
30–34 10,454 505.60 5,897 496.50 4,557 517.50
35–39 9,952 492.40 5,615 482.80 4,337 504.80
40–44 5,623 470.80 3,111 461.50 2,512 482.30
45–49 1,475 463.60 793 444.00 682 486.50
50–54 481 496.40 265 463.90 216 536.20
55–59 195 505.10 103 473.30 92 540.70
60–64 82 523.60 50 499.50 32 561.20
65 or older 26 538.10 12 554.00 14 524.50
SOURCE: Social Security Administration, Annual Award and Termination Transaction file, 100 percent data.
NOTES: Data exclude expedited reinstatement cases.
Starting with 2007, age is based on date of entitlement and not date of award. Entitlement can be retroactive and thus precede the date of award.
FRA = full retirement age.
a. Benefits awarded before the December cost-of-living increase are converted to the December rates before averages are computed.
CONTACT: Hazel P. Jenkins (410) 965-0164 or di.asr@ssa.gov.
Top of page. Table of contents.
Awards to All Disabled Beneficiaries
Table 37.
Distribution, by sex and diagnostic group, 2009
Diagnostic group Total Workers Widow(er)s Adult children
Number Percent Number Percent Number Percent Number Percent
All disabled beneficiaries
Total 1,081,983 100.0 970,696 100.0 31,518 100.0 79,769 100.0
Congenital anomalies 3,404 0.3 1,507 0.2 35 0.1 1,862 2.3
Endocrine, nutritional, and metabolic diseases 36,557 3.4 34,168 3.5 1,781 5.7 608 0.8
Infectious and parasitic diseases 10,981 1.0 10,440 1.1 284 0.9 257 0.3
Injuries 41,041 3.8 38,439 4.0 864 2.7 1,738 2.2
Mental disorders
Retardation 58,144 5.4 23,031 2.4 1,018 3.2 34,095 42.7
Other 226,681 21.0 193,350 19.9 7,354 23.3 25,977 32.6
Neoplasms 92,159 8.5 90,411 9.3 1,235 3.9 513 0.6
Diseases of the—
Blood and blood-forming organs 3,387 0.3 2,900 0.3 76 0.2 411 0.5
Circulatory system 103,313 9.5 100,007 10.3 2,724 8.6 582 0.7
Digestive system 22,610 2.1 21,827 2.2 586 1.9 197 0.2
Genitourinary system 21,152 2.0 20,434 2.1 321 1.0 397 0.5
Musculoskeletal system and connective tissue 314,738 29.1 303,035 31.2 10,548 33.5 1,155 1.4
Nervous system and sense organs 91,856 8.5 79,756 8.2 2,279 7.2 9,821 12.3
Respiratory system 39,743 3.7 37,938 3.9 1,611 5.1 194 0.2
Skin and subcutaneous tissue 2,294 0.2 2,154 0.2 81 0.3 59 0.1
Other 2,344 0.2 2,016 0.2 41 0.1 287 0.4
Unknown 11,579 1.1 9,283 1.0 680 2.2 1,616 2.0
Men
Subtotal 569,589 100.0 521,424 100.0 2,344 100.0 45,821 100.0
Congenital anomalies 1,761 0.3 817 0.2 1 a 943 2.1
Endocrine, nutritional, and metabolic diseases 18,671 3.3 18,286 3.5 102 4.4 283 0.6
Infectious and parasitic diseases 7,263 1.3 7,069 1.4 34 1.5 160 0.3
Injuries 26,524 4.7 25,197 4.8 112 4.8 1,215 2.7
Mental disorders
Retardation 32,887 5.8 14,176 2.7 64 2.7 18,647 40.7
Other 111,387 19.6 94,352 18.1 470 20.1 16,565 36.2
Neoplasms 46,970 8.2 46,576 8.9 91 3.9 303 0.7
Diseases of the—
Blood and blood-forming organs 1,548 0.3 1,354 0.3 5 0.2 189 0.4
Circulatory system 68,833 12.1 68,179 13.1 342 14.6 312 0.7
Digestive system 12,892 2.3 12,731 2.4 68 2.9 93 0.2
Genitourinary system 12,859 2.3 12,631 2.4 31 1.3 197 0.4
Musculoskeletal system and connective tissue 153,585 27.0 152,370 29.2 729 31.1 486 1.1
Nervous system and sense organs 46,582 8.2 41,211 7.9 128 5.5 5,243 11.4
Respiratory system 19,892 3.5 19,696 3.8 104 4.4 92 0.2
Skin and subcutaneous tissue 1,054 0.2 1,023 0.2 4 0.2 27 0.1
Other 1,168 0.2 1,000 0.2 5 0.2 163 0.4
Unknown 5,713 1.0 4,756 0.9 54 2.3 903 2.0
Women
Subtotal 512,394 100.0 449,272 100.0 29,174 100.0 33,948 100.0
Congenital anomalies 1,643 0.3 690 0.2 34 0.1 919 2.7
Endocrine, nutritional, and metabolic diseases 17,886 3.5 15,882 3.5 1,679 5.8 325 1.0
Infectious and parasitic diseases 3,718 0.7 3,371 0.8 250 0.9 97 0.3
Injuries 14,517 2.8 13,242 2.9 752 2.6 523 1.5
Mental disorders
Retardation 25,257 4.9 8,855 2.0 954 3.3 15,448 45.5
Other 115,294 22.5 98,998 22.0 6,884 23.6 9,412 27.7
Neoplasms 45,189 8.8 43,835 9.8 1,144 3.9 210 0.6
Diseases of the—
Blood and blood-forming organs 1,839 0.4 1,546 0.3 71 0.2 222 0.7
Circulatory system 34,480 6.7 31,828 7.1 2,382 8.2 270 0.8
Digestive system 9,718 1.9 9,096 2.0 518 1.8 104 0.3
Genitourinary system 8,293 1.6 7,803 1.7 290 1.0 200 0.6
Musculoskeletal system and connective tissue 161,153 31.5 150,665 33.5 9,819 33.7 669 2.0
Nervous system and sense organs 45,274 8.8 38,545 8.6 2,151 7.4 4,578 13.5
Respiratory system 19,851 3.9 18,242 4.1 1,507 5.2 102 0.3
Skin and subcutaneous tissue 1,240 0.2 1,131 0.3 77 0.3 32 0.1
Other 1,176 0.2 1,016 0.2 36 0.1 124 0.4
Unknown 5,866 1.1 4,527 1.0 626 2.1 713 2.1
SOURCE: Social Security Administration, Annual Award and Termination Transaction file, 100 percent data.
NOTES: Data exclude expedited reinstatement cases.
Effective 2001, the Social Security Administration initiated a special review of 130,000 Supplemental Security Income (SSI) recipients who are potentially eligible for Social Security disability benefits because of earnings while receiving SSI. Many of these claims awarded since 2001 were for individuals under the age of 35 who were diagnosed with a mental disorder.
a. Less than 0.05 percent.
CONTACT: Hazel P. Jenkins (410) 965-0164 or di.asr@ssa.gov.
Top of page. Table of contents.
Awards to All Disabled Beneficiaries
Table 38.
Distribution and average monthly benefit, by state or other area, 2009
State or area Workers Widow(er)s Adult children
Number Percent Average
monthly
benefit a
(dollars)
Number Percent Average
monthly
benefit a
(dollars)
Number Percent Average
monthly
benefit a
(dollars)
All areas 970,696 100.0 1,119.90 31,518 100.0 666.30 79,769 100.0 487.90
Alabama 25,430 2.6 1,101.80 1,051 3.3 656.50 1,719 2.2 474.00
Alaska 1,607 0.2 1,121.50 47 0.1 699.50 140 0.2 538.90
Arizona 14,269 1.5 1,175.60 400 1.3 683.90 1,050 1.3 520.30
Arkansas 15,659 1.6 1,061.60 588 1.9 589.60 1,175 1.5 439.40
California 74,745 7.7 1,063.30 2,087 6.6 715.90 6,560 8.2 523.80
Colorado 10,188 1.0 1,150.40 238 0.8 707.30 721 0.9 511.50
Connecticut 7,531 0.8 1,203.70 195 0.6 654.50 868 1.1 491.90
Delaware 3,178 0.3 1,175.10 75 0.2 624.50 206 0.3 487.50
District of Columbia 1,755 0.2 989.50 25 0.1 585.60 134 0.2 428.60
Florida 58,928 6.1 1,125.70 1,807 5.7 655.40 3,875 4.9 504.30
Georgia 33,689 3.5 1,128.80 1,130 3.6 625.50 2,060 2.6 522.00
Hawaii 2,874 0.3 1,167.10 77 0.2 683.40 249 0.3 525.20
Idaho 4,487 0.5 1,082.00 132 0.4 625.70 369 0.5 484.40
Illinois 33,100 3.4 1,168.40 1,044 3.3 709.10 3,277 4.1 494.00
Indiana 23,445 2.4 1,165.80 809 2.6 660.30 2,121 2.7 473.90
Iowa 8,202 0.8 1,102.50 240 0.8 654.70 1,010 1.3 421.00
Kansas 9,387 1.0 1,092.80 285 0.9 649.00 801 1.0 440.80
Kentucky 21,917 2.3 1,086.60 1,035 3.3 676.90 1,633 2.0 449.20
Louisiana 17,157 1.8 1,061.50 813 2.6 715.70 1,561 2.0 464.50
Maine 4,807 0.5 1,060.00 151 0.5 588.10 606 0.8 405.70
Maryland 15,151 1.6 1,161.10 339 1.1 707.30 1,088 1.4 538.80
Massachusetts 19,635 2.0 1,130.50 445 1.4 669.00 1,963 2.5 455.00
Michigan 42,705 4.4 1,183.40 1,303 4.1 738.90 3,967 5.0 511.00
Minnesota 13,961 1.4 1,125.50 245 0.8 651.30 1,516 1.9 448.80
Mississippi 13,952 1.4 1,086.60 715 2.3 606.30 1,238 1.6 429.30
Missouri 23,441 2.4 1,106.60 913 2.9 622.70 2,129 2.7 438.50
Montana 2,941 0.3 1,041.70 86 0.3 630.00 290 0.4 469.90
Nebraska 4,677 0.5 1,085.70 114 0.4 606.70 485 0.6 421.00
Nevada 6,555 0.7 1,159.70 174 0.6 666.30 322 0.4 525.60
New Hampshire 4,508 0.5 1,152.70 108 0.3 627.90 441 0.6 441.50
New Jersey 23,582 2.4 1,254.40 562 1.8 689.40 1,976 2.5 535.30
New Mexico 6,513 0.7 1,048.20 165 0.5 664.10 450 0.6 499.80
New York 58,030 6.0 1,150.20 1,586 5.0 697.60 5,364 6.7 528.60
North Carolina 36,891 3.8 1,128.30 1,237 3.9 566.40 2,632 3.3 478.90
North Dakota 1,427 0.1 1,067.30 19 0.1 650.60 180 0.2 433.10
Ohio 38,591 4.0 1,098.60 1,394 4.4 672.10 3,132 3.9 480.10
Oklahoma 14,101 1.5 1,067.50 586 1.9 640.40 1,155 1.4 461.20
Oregon 12,102 1.2 1,135.00 350 1.1 740.10 1,026 1.3 510.10
Pennsylvania 40,983 4.2 1,118.50 1,330 4.2 690.90 3,576 4.5 486.50
Rhode Island 3,383 0.3 1,096.70 93 0.3 621.10 350 0.4 417.10
South Carolina 21,318 2.2 1,141.00 835 2.6 569.10 1,345 1.7 485.30
South Dakota 1,905 0.2 1,042.40 51 0.2 529.10 209 0.3 406.50
Tennessee 26,797 2.8 1,107.60 1,155 3.7 618.70 1,873 2.3 488.10
Texas 68,007 7.0 1,093.00 2,420 7.7 700.40 4,567 5.7 491.70
Utah 5,071 0.5 1,118.70 130 0.4 765.30 550 0.7 494.50
Vermont 2,255 0.2 1,062.60 62 0.2 625.20 260 0.3 429.10
Virginia 20,688 2.1 1,137.80 671 2.1 638.10 1,747 2.2 498.80
Washington 19,499 2.0 1,159.50 519 1.6 734.10 1,548 1.9 536.90
West Virginia 8,295 0.9 1,127.90 431 1.4 736.10 706 0.9 487.10
Wisconsin 19,303 2.0 1,148.50 408 1.3 669.60 1,959 2.5 453.00
Wyoming 1,464 0.2 1,134.30 37 0.1 681.90 102 0.1 485.50
Outlying areas
Puerto Rico 19,221 2.0 988.50 692 2.2 583.20 1,214 1.5 411.80
Other b 918 0.1 955.20 56 0.2 687.40 143 0.2 383.00
SOURCE: Social Security Administration, Annual Award and Termination Transaction file, 100 percent data.
NOTE: Data exclude expedited reinstatement cases.
a. Benefits awarded before the December cost-of-living increase are converted to the December rates before averages are computed.
b. Includes American Samoa, Guam, Northern Mariana Islands, U.S. Virgin Islands, and foreign countries.
CONTACT: Hazel P. Jenkins (410) 965-0164 or di.asr@ssa.gov.
Top of page. Table of contents.
Awards to Disabled Workers
Table 39.
Percentage distribution, by sex and age, selected years 1960–2009
Year Number Percentage distribution Average
age
Total,
all ages
Under 30 30–34 35–39 a 40–44 45–49 50–54 55–59 60–61 62– FRA
All disabled workers b
2000 610,700 100.0 6.4 4.9 8.4 11.5 13.1 18.1 21.3 8.7 7.8 48.9
2001 661,900 100.0 7.8 5.3 8.0 10.8 12.9 18.0 21.6 8.5 7.1 48.6
2002 730,383 100.0 7.6 5.0 7.5 10.8 13.3 18.0 22.1 8.6 7.1 48.7
2003 755,706 100.0 6.9 5.0 7.2 10.6 13.4 18.1 22.5 9.0 7.3 49.0
2004 775,244 100.0 6.7 4.9 6.9 10.4 13.4 18.1 22.7 8.9 8.1 49.3
2005 821,207 100.0 6.4 4.6 6.6 10.2 13.4 18.4 23.1 8.4 8.9 49.5
2006 798,675 100.0 6.2 4.3 6.4 9.8 13.6 18.9 23.4 8.3 9.1 49.8
2007 804,787 100.0 7.9 4.6 6.9 10.3 13.5 18.8 22.9 8.2 6.9 48.8
2008 877,226 100.0 8.1 4.5 6.7 9.9 13.4 19.2 22.6 8.7 6.9 48.8
2009 970,696 100.0 8.2 4.5 6.6 9.5 13.3 19.7 22.8 8.6 6.8 48.8
Men
1960 168,466 100.0 0.8 a 7.0 6.5 10.5 16.7 20.0 11.8 26.7 54.5
1965 186,808 100.0 1.8 a 8.2 7.9 11.1 17.1 25.7 14.0 14.0 53.0
1970 258,072 100.0 6.7 a 7.6 6.5 10.1 14.7 23.5 12.3 18.7 52.1
1975 408,531 100.0 7.7 a 8.6 6.2 9.5 15.7 23.1 12.1 17.1 51.5
1980 275,185 100.0 8.3 a 9.7 6.0 8.4 14.7 24.6 12.3 16.0 51.2
1981 244,984 100.0 8.6 a 10.2 6.2 8.4 14.5 24.3 13.0 14.8 50.8
1982 207,453 100.0 8.4 a 10.4 6.3 8.4 14.1 24.6 12.9 14.8 50.9
1983 217,422 100.0 9.5 a 11.7 6.6 8.4 13.6 23.4 12.2 14.6 50.2
1984 247,833 100.0 9.2 a 12.8 7.1 8.7 13.4 22.6 12.2 14.0 50.0
1985 274,400 100.0 8.7 a 13.3 7.0 9.9 14.6 23.1 12.4 10.9 50.1
1986 273,700 100.0 10.7 a 15.3 8.1 9.4 14.3 21.3 11.1 9.8 48.7
1987 265,900 100.0 9.4 a 16.0 8.6 9.3 13.9 20.8 10.9 11.2 49.0
1988 265,700 100.0 8.4 a 16.0 9.7 9.0 14.6 21.3 10.5 10.4 49.2
1989 268,600 100.0 8.7 a 16.0 9.5 10.2 14.2 20.6 9.7 11.1 49.0
1990 293,300 100.0 10.9 a 16.9 9.4 9.5 13.5 20.5 10.3 8.9 48.1
1991 322,700 100.0 9.5 a 17.7 10.6 11.0 14.1 18.4 9.4 9.3 47.9
1992 395,600 100.0 9.5 a 18.5 10.8 11.0 13.0 18.6 9.8 8.9 47.8
1993 391,800 100.0 9.2 a 18.9 10.1 11.7 14.7 18.8 8.6 8.0 47.7
1994 379,300 100.0 6.8 a 18.4 10.8 12.7 15.4 19.3 9.0 7.7 48.4
1995 368,400 100.0 7.2 a 16.3 10.7 11.5 15.7 20.4 8.9 9.3 48.9
1996 347,100 100.0 6.9 7.2 9.0 10.8 13.2 16.2 19.9 9.3 7.6 48.7
1997 311,100 100.0 6.3 5.6 8.9 10.8 13.5 16.1 21.6 8.8 8.3 49.3
1998 331,400 100.0 6.3 6.2 8.1 11.1 12.4 18.3 21.6 8.1 8.0 49.2
1999 338,900 100.0 6.2 5.2 7.6 11.4 12.4 18.2 21.7 8.8 8.3 49.6
2000 328,700 100.0 6.8 4.6 8.3 10.7 12.7 17.6 21.1 9.1 9.1 49.1
2001 360,000 100.0 7.5 4.8 7.9 10.0 12.2 17.5 22.7 9.2 8.1 49.1
2002 394,741 100.0 7.9 4.7 7.1 10.2 12.6 17.6 22.9 9.3 7.8 49.0
2003 408,516 100.0 7.0 4.7 6.8 10.0 12.7 17.8 23.2 9.7 8.0 49.4
2004 416,560 100.0 6.8 4.6 6.5 9.8 12.8 17.7 23.4 9.6 8.9 49.6
2005 440,008 100.0 6.6 4.3 6.3 9.7 12.9 17.9 23.7 8.9 9.6 49.8
2006 425,285 100.0 6.4 4.1 6.1 9.2 13.0 18.4 24.0 8.8 9.9 50.1
2007 428,836 100.0 8.2 4.3 6.4 9.7 12.8 18.3 23.7 8.9 7.7 49.1
2008 466,966 100.0 8.4 4.2 6.1 9.3 12.7 18.6 23.4 9.5 7.8 49.2
2009 521,424 100.0 8.5 4.2 6.1 8.9 12.5 19.1 23.6 9.3 7.7 49.2
Women
1960 39,339 100.0 0.7 a 8.1 8.0 13.3 21.9 24.6 12.4 10.9 52.5
1965 66,691 100.0 1.1 a 6.5 7.4 11.7 19.3 28.3 14.1 11.5 53.2
1970 92,312 100.0 4.2 a 6.3 6.1 11.0 17.5 27.2 13.0 14.6 52.8
1975 183,518 100.0 6.1 a 7.3 6.1 10.1 17.7 25.5 12.2 15.0 52.1
1980 121,374 100.0 7.4 a 9.7 6.4 9.3 16.3 25.5 11.7 13.7 51.1
1981 106,863 100.0 7.8 a 10.2 6.5 9.5 16.4 25.1 12.0 12.5 50.8
1982 89,678 100.0 8.0 a 10.9 6.8 9.5 15.6 24.9 11.7 12.5 50.5
1983 94,127 100.0 9.0 a 12.2 7.4 9.5 14.8 23.5 10.9 12.7 49.8
1984 114,165 100.0 8.3 a 13.2 7.9 9.7 14.9 22.8 10.9 12.9 49.7
1985 134,500 100.0 8.6 a 12.9 8.0 10.6 15.8 23.3 10.1 10.6 49.7
1986 135,700 100.0 9.0 a 15.5 10.4 10.5 14.8 21.3 9.6 8.8 48.8
1987 143,700 100.0 7.5 a 15.2 8.1 11.2 15.8 23.4 9.6 9.1 49.5
1988 147,000 100.0 8.5 a 14.0 8.8 10.9 16.1 23.5 10.5 7.7 49.3
1989 146,900 100.0 7.8 a 14.8 10.4 11.9 13.8 21.2 10.8 9.2 49.1
1990 168,500 100.0 8.5 a 16.3 9.8 13.1 14.2 22.3 8.9 6.9 48.4
1991 190,400 100.0 8.5 a 16.8 10.1 12.2 16.2 19.5 8.9 7.8 48.4
1992 241,300 100.0 8.6 a 17.7 12.0 12.4 15.6 17.6 8.4 7.7 47.7
1993 237,900 100.0 7.5 a 17.5 11.2 13.1 16.5 19.7 6.8 7.6 48.1
1994 234,000 100.0 7.4 a 16.9 11.1 12.9 17.0 20.8 7.3 6.6 48.2
1995 263,200 100.0 6.4 a 16.7 11.4 13.8 17.2 20.5 7.6 6.4 48.5
1996 256,900 100.0 5.3 6.2 8.9 11.3 14.0 19.0 21.2 8.3 5.9 49.1
1997 250,200 100.0 6.2 6.0 10.3 12.2 14.1 19.0 19.0 6.8 6.4 48.4
1998 271,900 100.0 5.4 5.9 9.0 12.2 14.5 19.1 20.4 7.6 5.9 48.9
1999 266,900 100.0 5.7 5.9 8.7 12.5 15.4 18.1 20.6 6.6 6.5 48.7
2000 282,000 100.0 5.8 5.2 8.6 12.3 13.5 18.7 21.6 8.1 6.3 48.7
2001 301,900 100.0 8.0 5.9 8.2 11.8 13.8 18.5 20.2 7.7 6.0 48.0
2002 335,642 100.0 7.3 5.3 8.0 11.4 14.2 18.5 21.2 7.7 6.3 48.3
2003 347,190 100.0 6.8 5.4 7.7 11.3 14.2 18.5 21.7 8.1 6.5 48.6
2004 358,684 100.0 6.6 5.3 7.3 11.0 14.0 18.6 21.9 8.2 7.2 48.9
2005 381,199 100.0 6.2 5.0 7.0 10.7 14.0 19.0 22.3 7.7 8.0 49.2
2006 373,390 100.0 5.9 4.7 6.8 10.4 14.2 19.4 22.8 7.7 8.2 49.5
2007 375,951 100.0 7.5 5.0 7.4 11.1 14.4 19.4 22.0 7.4 5.9 48.4
2008 410,260 100.0 7.6 4.9 7.3 10.7 14.2 19.9 21.7 7.8 5.9 48.4
2009 449,272 100.0 7.8 4.9 7.1 10.3 14.3 20.4 21.8 7.7 5.8 48.4
SOURCES: Social Security Administration. For years before 2000, Annual Statistical Supplement to the Social Security Bulletin, based on the Master Beneficiary Record, various sampling rates; from 2000 to 2001, Annual Award and Termination Transaction file, 1 percent sample; data after 2001 are 100 percent data.
NOTES: Age in year of award from 1960 to 1984; age in month of award after 1984.
Data exclude closed period awards in 2002 and 2003 and expedited reinstatement cases since 2002.
Starting with 2007, age is based on date of entitlement and not date of award. Entitlement can be retroactive and thus precede the date of award.
FRA = full retirement age.
a. Ages 30–34 were grouped with ages 35–39 before 1996.
b. Combined data for men and women are not available before 2000.
CONTACT: Hazel P. Jenkins (410) 965-0164 or di.asr@ssa.gov.
Top of page. Table of contents.
Awards to Disabled Workers
Table 40.
Distribution, by diagnostic group, selected years 1960–2009
Year Total Congenital
anomalies
Endocrine,
nutritional,
and
metabolic
diseases
Infectious
and
parasitic
diseases a
Injuries Mental disorders b Neoplasms
Total Retardation Other
Number
1960 207,805 865 5,406 10,903 -- 17,287 -- -- 17,739
1961 279,758 1,637 7,070 15,153 -- 26,864 -- -- 23,103
1962 286,434 2,026 9,383 15,271 -- 37,315 -- -- 27,632
1963 224,229 1,646 7,563 10,859 6,496 24,526 -- -- 25,042
1967 310,947 -- 10,743 10,945 19,815 35,344 -- -- 33,358
1968 330,783 2,670 11,359 10,360 25,319 41,894 -- -- 36,560
1969 344,741 3,004 12,169 9,828 28,473 43,225 -- -- 35,740
1970 350,384 3,597 13,141 8,760 28,231 38,406 -- -- 36,095
1971 415,897 4,365 15,823 8,524 31,810 42,687 -- -- 39,629
1972 455,438 4,033 17,352 8,627 31,728 45,253 -- -- 43,667
1973 491,776 5,276 18,131 7,957 30,418 47,014 -- -- 50,644
1975 592,049 6,576 23,176 7,579 32,341 67,213 -- -- 59,852
1976 551,460 5,817 20,966 6,049 29,848 63,667 -- -- 57,656
1977 568,874 6,681 21,725 5,807 31,942 70,825 -- -- 59,833
1978 464,415 5,850 16,855 4,512 27,490 54,329 -- -- 54,878
1981 351,847 3,118 14,768 2,596 20,868 36,318 -- -- 56,410
1982 298,531 2,432 13,187 2,312 16,617 31,531 -- -- 50,999
1983 311,490 2,827 14,904 6,730 15,646 50,633 -- -- 52,379
1984 357,140 2,439 14,418 3,185 16,189 64,078 -- -- 59,104
1985 377,371 2,480 16,976 2,985 16,558 68,610 -- -- 55,120
1986 416,865 1,953 21,260 2,736 3,629 123,983 -- -- 53,176
1987 415,848 787 21,114 4,676 20,889 81,241 -- -- 55,339
1988 409,490 550 14,513 2,802 21,022 85,756 -- -- 53,944
1989 425,582 534 14,279 3,773 21,531 88,500 -- -- 60,352
1990 467,977 511 16,255 22,023 22,315 105,173 -- -- 65,939
1991 536,434 575 19,931 28,245 24,129 126,184 -- -- 69,244
1992 636,637 619 29,904 39,253 25,042 164,093 -- -- 77,175
1993 635,238 543 30,862 37,450 23,206 166,045 -- -- 80,266
1994 631,870 602 31,532 36,087 22,560 156,703 -- -- 89,231
1995 645,645 722 33,370 27,993 27,566 147,900 16,681 131,219 64,401
1996 624,254 777 33,832 23,324 27,616 132,022 14,062 117,960 63,321
1997 587,700 654 33,807 15,327 25,930 122,901 12,888 110,013 62,279
1998 608,382 676 36,373 12,680 25,926 131,502 14,506 116,996 63,973
1999 620,559 645 36,975 11,743 25,925 138,980 16,608 122,372 65,681
2000 610,700 700 17,100 10,700 28,700 143,200 17,600 125,600 63,600
2001 661,900 d 19,500 11,200 25,400 168,600 22,500 146,100 62,000
2002 730,383 1,113 21,830 10,966 28,169 185,313 22,352 162,961 70,369
2003 755,706 1,152 23,407 10,879 28,612 191,679 19,338 172,341 70,942
2004 775,244 1,166 24,341 10,510 29,580 192,832 20,479 172,353 73,637
2005 821,207 1,214 26,969 10,534 31,019 198,549 21,165 177,384 83,303
2006 798,675 1,170 27,272 10,165 31,231 185,035 19,842 165,193 82,146
2007 804,787 1,196 27,354 9,504 31,543 183,475 18,694 164,781 81,453
2008 877,226 1,255 30,023 9,887 34,842 199,738 19,506 180,232 84,544
2009 970,696 1,507 34,168 10,440 38,439 216,381 23,031 193,350 90,411
Percent
1960 100.0 0.4 2.6 5.2 -- 8.3 -- -- 8.5
1961 100.0 0.6 2.5 5.4 -- 9.6 -- -- 8.3
1962 100.0 0.7 3.3 5.3 -- 13.0 -- -- 9.6
1963 100.0 0.7 3.4 4.8 2.9 10.9 -- -- 11.2
1967 100.0 -- 3.5 3.5 6.4 11.4 -- -- 10.7
1968 100.0 0.8 3.4 3.1 7.7 12.7 -- -- 11.1
1969 100.0 0.9 3.5 2.9 8.3 12.5 -- -- 10.4
1970 100.0 1.0 3.8 2.5 8.1 11.0 -- -- 10.3
1971 100.0 1.0 3.8 2.0 7.6 10.3 -- -- 9.5
1972 100.0 0.9 3.8 1.9 7.0 9.9 -- -- 9.6
1973 100.0 1.1 3.7 1.6 6.2 9.6 -- -- 10.3
1975 100.0 1.1 3.9 1.3 5.5 11.4 -- -- 10.1
1976 100.0 1.1 3.8 1.1 5.4 11.5 -- -- 10.5
1977 100.0 1.2 3.8 1.0 5.6 12.5 -- -- 10.5
1978 100.0 1.3 3.6 1.0 5.9 11.7 -- -- 11.8
1981 100.0 0.9 4.2 0.7 5.9 10.3 -- -- 16.0
1982 100.0 0.8 4.4 0.8 5.6 10.6 -- -- 17.1
1983 100.0 0.9 4.8 2.2 5.0 16.3 -- -- 16.8
1984 100.0 0.7 4.0 0.9 4.5 17.9 -- -- 16.5
1985 100.0 0.7 4.5 0.8 4.4 18.2 -- -- 14.6
1986 100.0 0.5 5.1 0.7 0.9 29.7 -- -- 12.8
1987 100.0 0.2 5.1 1.1 5.0 19.5 -- -- 13.3
1988 100.0 0.1 3.5 0.7 5.1 20.9 -- -- 13.2
1989 100.0 0.1 3.4 0.9 5.1 20.8 -- -- 14.2
1990 100.0 0.1 3.5 4.7 4.8 22.5 -- -- 14.1
1991 100.0 0.1 3.7 5.3 4.5 23.5 -- -- 12.9
1992 100.0 0.1 4.7 6.2 3.9 25.8 -- -- 12.1
1993 100.0 0.1 4.9 5.9 3.7 26.1 -- -- 12.6
1994 100.0 0.1 5.0 5.7 3.6 24.8 -- -- 14.1
1995 100.0 0.1 5.2 4.3 4.3 22.9 2.6 20.3 10.0
1996 100.0 0.1 5.4 3.7 4.4 21.1 2.3 18.9 10.1
1997 100.0 0.1 5.8 2.6 4.4 20.9 2.2 18.7 10.6
1998 100.0 0.1 6.0 2.1 4.3 21.6 2.4 19.2 10.5
1999 100.0 0.1 6.0 1.9 4.2 22.4 2.7 19.7 10.6
2000 100.0 0.1 2.8 1.8 4.7 23.4 2.9 20.6 10.4
2001 100.0 d 2.9 1.7 3.8 25.5 3.4 22.1 9.4
2002 100.0 0.2 3.0 1.5 3.9 25.4 3.1 22.3 9.6
2003 100.0 0.2 3.1 1.4 3.8 25.4 2.6 22.8 9.4
2004 100.0 0.2 3.1 1.4 3.8 24.8 2.6 22.2 9.5
2005 100.0 0.1 3.3 1.3 3.8 24.2 2.6 21.6 10.1
2006 100.0 0.1 3.4 1.3 3.9 23.2 2.5 20.7 10.3
2007 100.0 0.1 3.4 1.2 3.9 22.8 2.3 20.5 10.1
2008 100.0 0.1 3.4 1.1 4.0 22.8 2.2 20.5 9.6
2009 100.0 0.2 3.5 1.1 4.0 22.3 2.4 19.9 9.3
(Continued)
Awards to Disabled Workers
Table 40.
Continued
Year Diseases of the— Other Unknown c
Blood and
blood-
forming
organs
Circulatory
system
Digestive
system
Genitourinary
system
Musculoskeletal
system and
connective
tissue
Nervous
system
and sense
organs
Respiratory
system
Skin and
subcutaneous
tissue
Number
1960 442 55,855 3,575 1,077 17,124 32,105 16,489 463 89 28,386
1961 566 71,860 4,300 1,608 23,241 44,709 20,030 794 125 38,698
1962 739 82,015 5,922 2,040 33,751 45,261 23,408 1,177 494 --
1963 597 66,468 4,437 1,725 21,744 32,712 19,107 719 588 --
1967 -- 81,507 7,627 -- 41,090 38,278 24,646 -- 7,594 --
1968 -- 80,906 7,806 2,926 43,677 41,758 22,635 -- 2,913 --
1969 -- 105,760 8,719 2,717 47,357 21,967 23,265 -- 2,517 --
1970 -- 108,906 9,051 2,912 52,086 22,575 24,254 -- 2,370 --
1971 1,043 131,854 11,629 3,501 66,558 26,442 30,103 1,667 262 --
1972 1,155 146,684 13,369 4,304 75,923 28,216 33,038 1,756 293 40
1973 1,347 158,202 14,614 4,810 85,431 31,139 34,656 1,854 283 --
1975 1,491 177,311 17,474 5,719 110,637 39,960 39,485 2,306 929 --
1976 2,039 165,182 15,194 4,907 105,907 36,156 35,210 2,532 330 --
1977 1,516 167,801 15,342 5,271 107,840 36,751 35,002 1,766 772 --
1978 1,236 134,634 12,407 4,719 86,921 29,314 28,005 2,017 1,248 --
1981 942 85,994 7,363 6,230 58,639 28,516 21,520 1,345 616 6,604
1982 808 74,242 6,067 3,165 48,985 26,886 19,766 998 536 --
1983 958 68,352 5,272 6,489 41,782 26,203 17,978 848 d d
1984 904 70,891 5,895 3,441 45,826 28,201 18,891 983 776 21,919
1985 890 72,764 5,626 3,348 49,214 28,733 20,213 1,110 992 31,752
1986 1,186 73,226 6,262 3,099 54,560 30,328 23,449 1,075 -- 16,943
1987 1,205 76,758 6,122 5,801 63,807 35,206 22,978 1,173 -- 18,752
1988 1,419 72,224 6,388 7,131 68,623 34,443 23,073 785 16,817 --
1989 1,524 70,235 6,803 9,010 71,419 34,756 21,400 828 20,638 --
1990 1,734 73,585 7,431 10,294 74,501 37,737 22,158 866 7,455 --
1991 1,904 78,339 8,648 10,874 92,469 41,551 23,798 1,021 9,522 --
1992 2,277 89,818 9,872 12,763 96,895 46,952 27,264 1,070 13,640 --
1993 2,075 88,623 10,026 13,390 94,255 45,742 27,494 1,118 14,143 --
1994 2,066 86,645 10,520 15,531 84,705 47,820 30,958 1,116 15,794 --
1995 2,006 83,065 11,167 11,956 141,306 46,477 28,831 1,643 14,746 2,496
1996 1,836 81,209 11,530 12,206 142,776 45,960 27,983 1,588 18,274 2,590
1997 1,815 76,531 11,310 12,151 135,430 45,496 26,483 1,473 14,436 1,677
1998 1,801 76,698 12,413 13,118 141,847 47,517 27,148 1,466 13,744 1,500
1999 1,911 74,755 13,389 13,842 146,754 49,869 26,981 1,416 10,252 1,441
2000 1,500 75,400 12,700 14,900 153,600 50,100 26,200 1,700 9,300 1,300
2001 2,200 82,500 15,600 16,300 162,100 54,600 28,300 d 10,000 1,800
2002 2,491 85,252 15,976 16,412 186,923 62,519 30,591 1,609 1,866 8,984
2003 2,408 85,896 17,084 16,968 199,014 64,369 32,007 1,622 1,871 7,796
2004 2,479 85,449 18,045 16,869 210,315 64,566 32,562 1,709 1,909 9,275
2005 2,501 89,247 19,094 18,317 226,914 66,712 33,998 1,783 1,989 9,064
2006 2,405 85,636 18,655 18,414 225,179 65,320 32,577 1,731 1,862 9,877
2007 2,509 86,706 18,558 19,060 233,608 65,187 32,336 1,781 2,112 8,405
2008 2,656 92,136 19,760 19,662 263,536 71,431 34,539 1,935 2,165 9,117
2009 2,900 100,007 21,827 20,434 303,035 79,756 37,938 2,154 2,016 9,283
Percent
1960 0.2 26.9 1.7 0.5 8.2 15.4 7.9 0.2 e 13.7
1961 0.2 25.7 1.5 0.6 8.3 16.0 7.2 0.3 e 13.8
1962 0.3 28.6 2.1 0.7 11.8 15.8 8.2 0.4 0.2 --
1963 0.3 29.6 2.0 0.8 9.7 14.6 8.5 0.3 0.3 --
1967 -- 26.2 2.5 -- 13.2 12.3 7.9 -- 2.4 --
1968 -- 24.5 2.4 0.9 13.2 12.6 6.8 -- 0.9 --
1969 -- 30.7 2.5 0.8 13.7 6.4 6.7 -- 0.7 --
1970 -- 31.1 2.6 0.8 14.9 6.4 6.9 -- 0.7 --
1971 0.3 31.7 2.8 0.8 16.0 6.4 7.2 0.4 0.1 --
1972 0.3 32.2 2.9 0.9 16.7 6.2 7.3 0.4 0.1 e
1973 0.3 32.2 3.0 1.0 17.4 6.3 7.0 0.4 0.1 --
1975 0.3 29.9 3.0 1.0 18.7 6.7 6.7 0.4 0.2 --
1976 0.4 30.0 2.8 0.9 19.2 6.6 6.4 0.5 0.1 --
1977 0.3 29.5 2.7 0.9 19.0 6.5 6.2 0.3 0.1 --
1978 0.3 29.0 2.7 1.0 18.7 6.3 6.0 0.4 0.3 --
1981 0.3 24.4 2.1 1.8 16.7 8.1 6.1 0.4 0.2 1.9
1982 0.3 24.9 2.0 1.1 16.4 9.0 6.6 0.3 0.2 --
1983 0.3 21.9 1.7 2.1 13.4 8.4 5.8 0.3 d d
1984 0.3 19.8 1.7 1.0 12.8 7.9 5.3 0.3 0.2 6.1
1985 0.2 19.3 1.5 0.9 13.0 7.6 5.4 0.3 0.3 8.4
1986 0.3 17.6 1.5 0.7 13.1 7.3 5.6 0.3 -- 4.1
1987 0.3 18.5 1.5 1.4 15.3 8.5 5.5 0.3 -- 4.5
1988 0.3 17.6 1.6 1.7 16.8 8.4 5.6 0.2 4.1 --
1989 0.4 16.5 1.6 2.1 16.8 8.2 5.0 0.2 4.8 --
1990 0.4 15.7 1.6 2.2 15.9 8.1 4.7 0.2 1.6 --
1991 0.4 14.6 1.6 2.0 17.2 7.7 4.4 0.2 1.8 --
1992 0.4 14.1 1.6 2.0 15.2 7.4 4.3 0.2 2.1 --
1993 0.3 14.0 1.6 2.1 14.8 7.2 4.3 0.2 2.2 --
1994 0.3 13.7 1.7 2.5 13.4 7.6 4.9 0.2 2.5 --
1995 0.3 12.9 1.7 1.9 21.9 7.2 4.5 0.3 2.3 0.4
1996 0.3 13.0 1.8 2.0 22.9 7.4 4.5 0.3 2.9 0.4
1997 0.3 13.0 1.9 2.1 23.0 7.7 4.5 0.3 2.5 0.3
1998 0.3 12.6 2.0 2.2 23.3 7.8 4.5 0.2 2.3 0.2
1999 0.3 12.0 2.2 2.2 23.6 8.0 4.3 0.2 1.7 0.2
2000 0.2 12.3 2.1 2.4 25.2 8.2 4.3 0.3 1.5 0.2
2001 0.3 12.5 2.4 2.5 24.5 8.2 4.3 d 1.5 0.3
2002 0.3 11.7 2.2 2.2 25.6 8.6 4.2 0.2 0.3 1.2
2003 0.3 11.4 2.3 2.2 26.3 8.5 4.2 0.2 0.2 1.0
2004 0.3 11.0 2.3 2.2 27.1 8.3 4.2 0.2 0.2 1.2
2005 0.3 10.9 2.3 2.2 27.6 8.1 4.1 0.2 0.2 1.1
2006 0.3 10.7 2.3 2.3 28.2 8.2 4.1 0.2 0.2 1.2
2007 0.3 10.8 2.3 2.4 29.0 8.1 4.0 0.2 0.3 1.0
2008 0.3 10.5 2.3 2.2 30.0 8.1 3.9 0.2 0.2 1.0
2009 0.3 10.3 2.2 2.1 31.2 8.2 3.9 0.2 0.2 1.0
SOURCES: Social Security Administration. For years before 2000, Annual Statistical Supplement to the Social Security Bulletin, based on the Master Beneficiary Record, various sampling rates; from 2000 to 2001, Annual Award and Termination Transaction file, 1 percent sample; data after 2001 are 100 percent data.
NOTES: Data exclude closed period awards in 2002 and 2003 and expedited reinstatement cases since 2002.
Data from 1964 to 1966 are not available. Before 1995, diagnostic data for cases awarded at the appeals levels were estimated on the basis of the diagnosis of cases allowed at the initial disability determination level.
Effective 2001, the Social Security Administration initiated a special review of 130,000 Supplemental Security Income (SSI) recipients who are potentially eligible for Social Security disability benefits because of earnings while receiving SSI. Many of these claims awarded since 2001 were for individuals under the age of 35 who were diagnosed with a mental disorder.
-- = not available.
a. AIDS and HIV records are counted in "Infectious and parasitic diseases." Before 1990, they were included in "Other."
b. Mental retardation was not identified separately before 1995.
c. Beginning with 2002, several ill-defined impairment codes were reclassified and added to "Unknown."
d. Suppressed to avoid disclosing information about particular individuals.
e. Less than 0.05 percent.
CONTACT: Hazel P. Jenkins (410) 965-0164 or di.asr@ssa.gov.
Top of page. Table of contents.
Awards to Disabled Workers
Table 41.
Distribution of workers under age 50, by diagnostic group, selected years 1975–2009
Year Total Congenital
anomalies
Endocrine,
nutritional,
and
metabolic
diseases
Infectious
and
parasitic
diseases a
Injuries Mental disorders b Neoplasms
Total Retardation Other
Number
1975 183,493 3,712 6,511 3,357 17,945 42,119 -- -- 15,588
1981 123,090 1,945 5,188 1,209 13,327 24,633 -- -- 15,017
1982 109,279 1,579 4,739 1,096 11,088 21,654 -- -- 14,581
1983 120,606 1,429 5,630 3,759 10,036 35,331 -- -- 14,827
1984 140,792 1,375 5,750 1,528 9,535 43,680 -- -- 16,173
1985 158,152 1,438 7,534 1,510 10,357 49,313 -- -- 16,857
1986 188,355 1,202 10,816 1,534 1,882 89,821 -- -- 16,318
1987 184,481 498 12,405 3,262 13,064 58,970 -- -- 17,595
1988 183,017 326 5,848 1,383 12,590 63,282 -- -- 16,859
1989 189,708 311 6,088 2,497 12,761 64,093 -- -- 19,298
1990 215,381 317 7,190 19,290 12,929 77,901 -- -- 21,597
1991 255,448 384 8,949 24,838 13,892 94,345 -- -- 23,162
1992 313,175 404 15,349 34,766 13,691 125,609 -- -- 26,485
1993 312,619 350 15,550 33,072 12,690 126,586 -- -- 27,841
1994 292,987 384 15,107 31,210 11,563 116,812 -- -- 30,791
1995 308,624 472 14,963 23,736 15,325 108,516 13,731 94,785 22,367
1996 294,077 513 15,013 19,633 15,674 95,089 11,661 83,428 21,940
1997 265,019 435 14,667 12,361 14,401 85,486 10,679 74,807 21,245
1998 273,282 462 15,768 9,817 14,321 90,072 11,880 78,192 22,093
1999 259,680 370 15,426 8,667 13,399 86,642 9,341 77,301 21,960
2000 269,800 d 6,000 6,900 16,200 98,300 14,400 83,900 21,100
2001 296,800 d 7,300 8,900 12,900 118,700 20,200 98,500 20,600
2002 322,539 796 7,875 7,677 13,952 128,791 19,544 109,247 23,725
2003 325,723 857 7,944 7,559 13,716 130,964 16,605 114,359 23,381
2004 326,862 851 8,288 6,991 14,146 129,592 17,699 111,893 23,577
2005 338,815 877 8,909 6,892 14,806 132,116 18,193 113,923 26,130
2006 321,632 816 8,995 6,524 14,501 120,914 17,071 103,843 25,146
2007 347,570 878 10,257 6,311 15,616 126,825 17,008 109,817 25,383
2008 373,551 905 11,292 6,300 16,640 138,260 17,692 120,568 25,515
2009 409,425 1,093 12,569 6,513 17,601 150,113 20,774 129,339 27,086
Percent
1975 100.0 2.0 3.5 1.8 9.8 23.0 -- -- 8.5
1981 100.0 1.6 4.2 1.0 10.8 20.0 -- -- 12.2
1982 100.0 1.4 4.3 1.0 10.1 19.8 -- -- 13.3
1983 100.0 1.2 4.7 3.1 8.3 29.3 -- -- 12.3
1984 100.0 1.0 4.1 1.1 6.8 31.0 -- -- 11.5
1985 100.0 0.9 4.8 1.0 6.5 31.2 -- -- 10.7
1986 100.0 0.6 5.7 0.8 1.0 47.7 -- -- 8.7
1987 100.0 0.3 6.7 1.8 7.1 32.0 -- -- 9.5
1988 100.0 0.2 3.2 0.8 6.9 34.6 -- -- 9.2
1989 100.0 0.2 3.2 1.3 6.7 33.8 -- -- 10.2
1990 100.0 0.1 3.3 9.0 6.0 36.2 -- -- 10.0
1991 100.0 0.2 3.5 9.7 5.4 36.9 -- -- 9.1
1992 100.0 0.1 4.9 11.1 4.4 40.1 -- -- 8.5
1993 100.0 0.1 5.0 10.6 4.1 40.5 -- -- 8.9
1994 100.0 0.1 5.2 10.7 3.9 39.9 -- -- 10.5
1995 100.0 0.2 4.8 7.7 5.0 35.2 4.4 30.7 7.2
1996 100.0 0.2 5.1 6.7 5.3 32.3 4.0 28.4 7.5
1997 100.0 0.2 5.5 4.7 5.4 32.3 4.0 28.2 8.0
1998 100.0 0.2 5.8 3.6 5.2 33.0 4.3 28.6 8.1
1999 100.0 0.1 5.9 3.3 5.2 33.4 3.6 29.8 8.5
2000 100.0 d 2.2 2.6 6.0 36.5 5.4 31.2 7.8
2001 100.0 d 2.5 3.0 4.3 40.0 6.8 33.2 6.9
2002 100.0 0.2 2.4 2.4 4.3 39.9 6.1 33.9 7.4
2003 100.0 0.3 2.4 2.3 4.2 40.2 5.1 35.1 7.2
2004 100.0 0.3 2.5 2.1 4.3 39.6 5.4 34.2 7.2
2005 100.0 0.3 2.6 2.0 4.4 39.0 5.4 33.6 7.7
2006 100.0 0.3 2.8 2.0 4.5 37.6 5.3 32.3 7.8
2007 100.0 0.3 3.0 1.8 4.5 36.5 4.9 31.6 7.3
2008 100.0 0.2 3.0 1.7 4.5 37.0 4.7 32.3 6.8
2009 100.0 0.3 3.1 1.6 4.3 36.7 5.1 31.6 6.6
(Continued)
Awards to Disabled Workers
Table 41.
Continued
Year Diseases of the— Other Unknown c
Blood and
blood-
forming
organs
Circulatory
system
Digestive
system
Genitourinary
system
Musculoskeletal
system and
connective
tissue
Nervous
system
and sense
organs
Respiratory
system
Skin and
subcutaneous
tissue
Number
1975 748 30,293 5,856 2,534 30,635 17,326 5,459 954 456 --
1981 516 15,278 3,000 3,314 21,076 14,478 3,189 687 d d
1982 416 14,309 2,761 1,740 17,889 13,882 2,757 538 250 --
1983 457 13,589 2,292 2,540 14,158 13,456 2,434 486 d d
1984 537 13,508 2,304 1,711 14,295 14,041 2,463 475 270 13,147
1985 472 13,650 2,756 1,791 15,060 14,724 2,771 485 -- 19,434
1986 688 13,946 3,020 1,684 17,148 16,295 3,043 537 -- 10,421
1987 739 16,518 2,764 3,005 20,519 19,057 3,535 659 -- 11,891
1988 867 15,535 3,158 4,257 23,285 18,364 3,771 457 13,035 --
1989 946 14,224 3,311 5,364 22,628 18,896 3,464 404 15,424 --
1990 1,094 15,157 3,693 6,171 22,068 20,627 3,538 428 3,381 --
1991 1,218 16,559 4,403 6,437 29,444 22,795 4,073 524 4,425 --
1992 1,478 18,775 5,182 7,595 26,347 26,120 4,599 573 6,202 --
1993 1,342 19,040 5,328 7,812 26,920 24,901 4,664 593 5,930 --
1994 1,278 16,949 5,537 8,840 17,918 25,350 4,929 572 5,747 --
1995 1,250 17,490 6,036 6,705 51,664 24,814 5,705 899 6,859 1,823
1996 1,118 17,608 6,308 6,872 54,008 24,412 5,747 945 9,197 --
1997 1,053 16,333 6,029 6,724 48,741 23,479 5,286 826 6,565 1,388
1998 1,072 16,607 6,683 7,066 50,426 24,297 5,517 851 7,000 1,230
1999 1,031 15,065 7,022 7,172 49,302 23,386 4,783 783 4,383 289
2000 d 15,900 6,900 8,500 51,900 25,000 5,400 d 4,700 --
2001 d 16,900 7,600 9,900 50,400 29,900 5,200 d 4,600 1,000
2002 1,481 18,348 7,999 8,649 58,796 31,571 6,221 877 945 4,836
2003 1,405 18,479 8,178 8,738 60,594 31,514 6,663 848 920 3,963
2004 1,429 17,862 8,375 8,441 63,432 31,142 6,537 937 925 4,337
2005 1,418 18,951 8,280 8,966 67,128 31,498 6,659 955 936 4,294
2006 1,367 18,174 7,889 8,993 65,964 30,019 6,402 892 866 4,170
2007 1,481 20,900 8,351 9,328 78,196 31,080 7,171 934 1,145 3,714
2008 1,593 21,714 8,566 9,323 86,112 33,793 7,427 1,093 1,084 3,934
2009 1,681 23,611 9,228 9,745 97,513 37,991 8,336 1,225 1,028 4,092
Percent
1975 0.4 16.5 3.2 1.4 16.7 9.4 3.0 0.5 0.2 --
1981 0.4 12.4 2.4 2.7 17.1 11.8 2.6 0.6 d d
1982 0.4 13.1 2.5 1.6 16.4 12.7 2.5 0.5 0.2 --
1983 0.4 11.3 1.9 2.1 11.7 11.2 2.0 0.4 d d
1984 0.4 9.6 1.6 1.2 10.2 10.0 1.7 0.3 0.2 9.3
1985 0.3 8.6 1.7 1.1 9.5 9.3 1.8 0.3 -- 12.3
1986 0.4 7.4 1.6 0.9 9.1 8.7 1.6 0.3 -- 5.5
1987 0.4 9.0 1.5 1.6 11.1 10.3 1.9 0.4 -- 6.4
1988 0.5 8.5 1.7 2.3 12.7 10.0 2.1 0.2 7.1 --
1989 0.5 7.5 1.7 2.8 11.9 10.0 1.8 0.2 8.1 --
1990 0.5 7.0 1.7 2.9 10.2 9.6 1.6 0.2 1.6 --
1991 0.5 6.5 1.7 2.5 11.5 8.9 1.6 0.2 1.7 --
1992 0.5 6.0 1.7 2.4 8.4 8.3 1.5 0.2 2.0 --
1993 0.4 6.1 1.7 2.5 8.6 8.0 1.5 0.2 1.9 --
1994 0.4 5.8 1.9 3.0 6.1 8.7 1.7 0.2 2.0 --
1995 0.4 5.7 2.0 2.2 16.7 8.0 1.8 0.3 2.2 0.6
1996 0.4 6.0 2.1 2.3 18.4 8.3 2.0 0.3 3.1 --
1997 0.4 6.2 2.3 2.5 18.4 8.9 2.0 0.3 2.5 0.5
1998 0.4 6.1 2.4 2.6 18.5 8.9 2.0 0.3 2.6 0.5
1999 0.4 5.8 2.7 2.8 19.0 9.0 1.8 0.3 1.7 0.1
2000 d 5.9 2.6 3.2 19.3 9.3 2.0 d 1.7 --
2001 d 5.7 2.6 3.3 17.0 10.1 1.8 d 1.6 0.3
2002 0.5 5.7 2.5 2.7 18.2 9.8 1.9 0.3 0.3 1.5
2003 0.4 5.7 2.5 2.7 18.6 9.7 2.0 0.3 0.3 1.2
2004 0.4 5.5 2.6 2.6 19.4 9.5 2.0 0.3 0.3 1.3
2005 0.4 5.6 2.4 2.6 19.8 9.3 2.0 0.3 0.3 1.3
2006 0.4 5.7 2.5 2.8 20.5 9.3 2.0 0.3 0.3 1.3
2007 0.4 6.0 2.4 2.7 22.5 8.9 2.1 0.3 0.3 1.1
2008 0.4 5.8 2.3 2.5 23.1 9.0 2.0 0.3 0.3 1.1
2009 0.4 5.8 2.3 2.4 23.8 9.3 2.0 0.3 0.3 1.0
SOURCES: Social Security Administration. For years before 2000, Annual Statistical Supplement to the Social Security Bulletin, based on the Master Beneficiary Record, various sampling rates; from 2000 to 2001, Annual Award and Termination Transaction file, 1 percent sample; data after 2001 are 100 percent data.
NOTES: Data exclude closed period awards in 2002 and 2003 and expedited reinstatement cases since 2002.
Before 1995, diagnostic data for cases awarded at the appeals levels were estimated on the basis of the diagnosis of cases allowed at the initial disability determination level.
Effective 2001, the Social Security Administration initiated a special review of 130,000 Supplemental Security Income (SSI) recipients who are potentially eligible for Social Security disability benefits because of earnings while receiving SSI. Many of these claims awarded since 2001 were for individuals under the age of 35 who were diagnosed with a mental disorder.
Starting with 2007, age is based on date of entitlement and not date of award. Entitlement can be retroactive and thus precede the date of award.
-- = not available.
a. AIDS and HIV records are counted in "Infectious and parasitic diseases." Before 1990, they were included in "Other."
b. Mental retardation was not identified separately before 1995.
c. Beginning with 2002, several ill-defined impairment codes were reclassified and added to "Unknown."
d. Suppressed to avoid disclosing information about particular individuals.
CONTACT: Hazel P. Jenkins (410) 965-0164 or di.asr@ssa.gov.
Top of page. Table of contents.
Awards to Disabled Workers
Table 42.
Distribution of workers aged 50 or older, by diagnostic group, selected years 1975–2009
Year Total Congenital
anomalies
Endocrine,
nutritional,
and
metabolic
diseases
Infectious
and
parasitic
diseases a
Injuries Mental disorders b Neoplasms
Total Retardation Other
Number
1975 408,556 2,864 16,665 4,222 14,396 25,094 -- -- 44,264
1981 222,162 1,173 9,580 1,387 7,541 11,685 -- -- 41,393
1982 189,252 853 8,448 1,216 5,529 9,877 -- -- 36,418
1983 190,884 1,398 9,274 2,971 5,610 15,302 -- -- 37,552
1984 216,348 1,064 8,668 1,657 6,654 20,398 -- -- 42,931
1985 219,219 1,042 9,442 1,475 6,201 19,297 -- -- 38,263
1986 228,510 751 10,444 1,202 1,747 34,162 -- -- 36,858
1987 231,367 289 8,709 1,414 7,825 22,271 -- -- 37,744
1988 226,473 224 8,665 1,419 8,432 22,474 -- -- 37,085
1989 235,874 223 8,191 1,276 8,770 24,407 -- -- 41,054
1990 252,596 194 9,065 2,733 9,386 27,272 -- -- 44,342
1991 280,986 191 10,982 3,407 10,237 31,839 -- -- 46,082
1992 323,462 215 14,555 4,487 11,351 38,484 -- -- 50,690
1993 322,619 193 15,312 4,378 10,516 39,459 -- -- 52,425
1994 338,833 218 16,425 4,877 10,997 39,891 -- -- 58,440
1995 337,021 250 18,407 4,257 12,241 39,384 2,950 36,434 42,034
1996 330,177 264 18,819 3,691 11,942 36,933 2,401 34,532 41,381
1997 322,681 219 19,140 2,966 11,529 37,415 2,209 35,206 41,034
1998 335,100 214 20,605 2,863 11,605 41,430 2,626 38,804 41,880
1999 360,879 275 21,549 3,076 12,526 52,338 7,267 45,071 43,721
2000 340,900 d 11,100 3,800 12,500 44,900 3,200 41,700 42,500
2001 365,100 d 12,200 2,300 12,500 49,900 2,300 47,600 41,400
2002 407,844 317 13,955 3,289 14,217 56,522 2,808 53,714 46,644
2003 429,983 295 15,463 3,320 14,896 60,715 2,733 57,982 47,561
2004 448,382 315 16,053 3,519 15,434 63,240 2,780 60,460 50,060
2005 482,392 337 18,060 3,642 16,213 66,433 2,972 63,461 57,173
2006 477,043 354 18,277 3,641 16,730 64,121 2,771 61,350 57,000
2007 457,217 318 17,097 3,193 15,927 56,650 1,686 54,964 56,070
2008 503,675 350 18,731 3,587 18,202 61,478 1,814 59,664 59,029
2009 561,271 414 21,599 3,927 20,838 66,268 2,257 64,011 63,325
Percent
1975 100.0 0.7 4.1 1.0 3.5 6.1 -- -- 10.8
1981 100.0 0.5 4.3 0.6 3.4 5.3 -- -- 18.6
1982 100.0 0.5 4.5 0.6 2.9 5.2 -- -- 19.2
1983 100.0 0.7 4.9 1.6 2.9 8.0 -- -- 19.7
1984 100.0 0.5 4.0 0.8 3.1 9.4 -- -- 19.8
1985 100.0 0.5 4.3 0.7 2.8 8.8 -- -- 17.5
1986 100.0 0.3 4.6 0.5 0.8 14.9 -- -- 16.1
1987 100.0 0.1 3.8 0.6 3.4 9.6 -- -- 16.3
1988 100.0 0.1 3.8 0.6 3.7 9.9 -- -- 16.4
1989 100.0 0.1 3.5 0.5 3.7 10.3 -- -- 17.4
1990 100.0 0.1 3.6 1.1 3.7 10.8 -- -- 17.6
1991 100.0 0.1 3.9 1.2 3.6 11.3 -- -- 16.4
1992 100.0 0.1 4.5 1.4 3.5 11.9 -- -- 15.7
1993 100.0 0.1 4.7 1.4 3.3 12.2 -- -- 16.2
1994 100.0 0.1 4.8 1.4 3.2 11.8 -- -- 17.2
1995 100.0 0.1 5.5 1.3 3.6 11.7 0.9 10.8 12.5
1996 100.0 0.1 5.7 1.1 3.6 11.2 0.7 10.5 12.5
1997 100.0 0.1 5.9 0.9 3.6 11.6 0.7 10.9 12.7
1998 100.0 0.1 6.1 0.9 3.5 12.4 0.8 11.6 12.5
1999 100.0 0.1 6.0 0.9 3.5 14.5 2.0 12.5 12.1
2000 100.0 d 3.3 1.1 3.7 13.2 0.9 12.2 12.5
2001 100.0 d 3.3 0.6 3.4 13.7 0.6 13.0 11.3
2002 100.0 0.1 3.4 0.8 3.5 13.9 0.7 13.2 11.4
2003 100.0 0.1 3.6 0.8 3.5 14.1 0.6 13.5 11.1
2004 100.0 0.1 3.6 0.8 3.4 14.1 0.6 13.5 11.2
2005 100.0 0.1 3.7 0.8 3.4 13.8 0.6 13.2 11.9
2006 100.0 0.1 3.8 0.8 3.5 13.5 0.6 12.9 11.9
2007 100.0 0.1 3.7 0.7 3.5 12.4 0.4 12.0 12.3
2008 100.0 0.1 3.7 0.7 3.6 12.2 0.4 11.8 11.7
2009 100.0 0.1 3.8 0.7 3.7 11.8 0.4 11.4 11.3
(Continued)
Awards to Disabled Workers
Table 42.
Continued
Year Diseases of the— Other Unknown c
Blood and
blood-
forming
organs
Circulatory
system
Digestive
system
Genitourinary
system
Musculoskeletal
system and
connective
tissue
Nervous
system
and sense
organs
Respiratory
system
Skin and
subcutaneous
tissue
Number
1975 743 147,018 11,618 3,185 80,002 22,634 34,026 1,352 473 --
1981 426 70,716 4,363 2,916 37,563 14,038 18,331 658 d d
1982 392 59,933 3,306 1,425 31,096 13,004 17,009 460 287 --
1983 501 54,763 2,980 3,949 27,624 12,747 15,544 362 d d
1984 367 57,383 3,591 1,730 31,531 14,160 16,428 508 506 8,772
1985 418 59,114 2,870 1,557 34,154 14,009 17,442 625 -- 13,310
1986 498 59,280 3,242 1,415 37,412 14,033 20,406 538 -- 6,522
1987 466 60,240 3,358 2,796 43,288 16,149 19,443 514 -- 6,861
1988 552 56,689 3,230 2,874 45,338 16,079 19,302 328 3,782 --
1989 578 56,011 3,492 3,646 48,791 15,860 17,936 424 5,216 --
1990 640 58,428 3,738 4,123 52,433 17,110 18,620 438 4,074 --
1991 686 61,780 4,245 4,437 63,025 18,756 19,725 497 5,097 --
1992 799 71,043 4,690 5,168 70,548 20,832 22,665 497 7,438 --
1993 733 69,583 4,698 5,578 67,335 20,841 22,830 525 8,213 --
1994 788 69,696 4,983 6,691 66,787 22,470 26,029 544 10,047 --
1995 756 65,575 5,131 5,251 89,642 21,663 23,126 744 8,560 --
1996 718 63,601 5,222 5,334 88,768 21,548 22,236 643 9,077 --
1997 762 60,198 5,281 5,427 86,689 22,017 21,197 647 7,871 289
1998 729 60,091 5,730 6,052 91,421 23,200 21,631 615 6,744 290
1999 880 59,690 6,367 6,670 97,452 26,483 22,198 633 5,869 1,152
2000 d 59,500 5,800 6,400 101,700 25,100 20,800 d 4,600 600
2001 d 65,600 8,000 6,400 111,700 24,700 23,100 d 5,400 800
2002 1,010 66,904 7,977 7,763 128,127 30,948 24,370 732 921 4,148
2003 1,003 67,417 8,906 8,230 138,420 32,855 25,344 774 951 3,833
2004 1,050 67,587 9,670 8,428 146,883 33,424 26,025 772 984 4,938
2005 1,083 70,296 10,814 9,351 159,786 35,214 27,339 828 1,053 4,770
2006 1,038 67,462 10,766 9,421 159,215 35,301 26,175 839 996 5,707
2007 1,028 65,806 10,207 9,732 155,412 34,107 25,165 847 967 4,691
2008 1,063 70,422 11,194 10,339 177,424 37,638 27,112 842 1,081 5,183
2009 1,219 76,396 12,599 10,689 205,522 41,765 29,602 929 988 5,191
Percent
1975 0.2 36.0 2.8 0.8 19.6 5.5 8.3 0.3 0.1 --
1981 0.2 31.8 2.0 1.3 16.9 6.3 8.3 0.3 d d
1982 0.2 31.7 1.7 0.8 16.4 6.9 9.0 0.2 0.2 --
1983 0.3 28.7 1.6 2.1 14.5 6.7 8.1 0.2 d d
1984 0.2 26.5 1.7 0.8 14.6 6.5 7.6 0.2 0.2 4.1
1985 0.2 27.0 1.3 0.7 15.6 6.4 8.0 0.3 -- 6.1
1986 0.2 25.9 1.4 0.6 16.4 6.1 8.9 0.2 -- 2.9
1987 0.2 26.0 1.5 1.2 18.7 7.0 8.4 0.2 -- 3.0
1988 0.2 25.0 1.4 1.3 20.0 7.1 8.5 0.1 1.7 --
1989 0.2 23.7 1.5 1.5 20.7 6.7 7.6 0.2 2.2 --
1990 0.3 23.1 1.5 1.6 20.8 6.8 7.4 0.2 1.6 --
1991 0.2 22.0 1.5 1.6 22.4 6.7 7.0 0.2 1.8 --
1992 0.2 22.0 1.4 1.6 21.8 6.4 7.0 0.2 2.3 --
1993 0.2 21.6 1.5 1.7 20.9 6.5 7.1 0.2 2.5 --
1994 0.2 20.6 1.5 2.0 19.7 6.6 7.7 0.2 3.0 --
1995 0.2 19.5 1.5 1.6 26.6 6.4 6.9 0.2 2.5 --
1996 0.2 19.3 1.6 1.6 26.9 6.5 6.7 0.2 2.7 --
1997 0.2 18.7 1.6 1.7 26.9 6.8 6.6 0.2 2.4 0.1
1998 0.2 17.9 1.7 1.8 27.3 6.9 6.5 0.2 2.0 0.1
1999 0.2 16.5 1.8 1.8 27.0 7.3 6.2 0.2 1.6 0.3
2000 d 17.5 1.7 1.9 29.8 7.4 6.1 d 1.3 0.2
2001 d 18.0 2.2 1.8 30.6 6.8 6.3 d 1.5 0.2
2002 0.2 16.4 2.0 1.9 31.4 7.6 6.0 0.2 0.2 1.0
2003 0.2 15.7 2.1 1.9 32.2 7.6 5.9 0.2 0.2 0.9
2004 0.2 15.1 2.2 1.9 32.8 7.5 5.8 0.2 0.2 1.1
2005 0.2 14.6 2.2 1.9 33.1 7.3 5.7 0.2 0.2 1.0
2006 0.2 14.1 2.3 2.0 33.4 7.4 5.5 0.2 0.2 1.2
2007 0.2 14.4 2.2 2.1 34.0 7.5 5.5 0.2 0.2 1.0
2008 0.2 14.0 2.2 2.1 35.2 7.5 5.4 0.2 0.2 1.0
2009 0.2 13.6 2.2 1.9 36.6 7.4 5.3 0.2 0.2 0.9
SOURCES: Social Security Administration. For years before 2000, Annual Statistical Supplement to the Social Security Bulletin, based on the Master Beneficiary Record, various sampling rates; from 2000 to 2001, Annual Award and Termination Transaction file, 1 percent sample; data after 2001 are 100 percent data.
NOTES: Data exclude closed period awards in 2002 and 2003 and expedited reinstatement cases since 2002.
Before 1995, diagnostic data for cases awarded at the appeals levels were estimated on the basis of the diagnosis of cases allowed at the initial disability determination level.
Effective 2001, the Social Security Administration initiated a special review of 130,000 Supplemental Security Income (SSI) recipients who are potentially eligible for Social Security disability benefits because of earnings while receiving SSI. Many of these claims awarded since 2001 were for individuals under the age of 35 who were diagnosed with a mental disorder.
Starting with 2007, age is based on date of entitlement and not date of award. Entitlement can be retroactive and thus precede the date of award.
-- = not available.
a. AIDS and HIV records are counted in "Infectious and parasitic diseases." Before 1990, they were included in "Other."
b. Mental retardation was not identified separately before 1995.
c. Beginning with 2002, several ill-defined impairment codes were reclassified and added to "Unknown."
d. Suppressed to avoid disclosing information about particular individuals.
CONTACT: Hazel P. Jenkins (410) 965-0164 or di.asr@ssa.gov.
Top of page. Table of contents.
Awards to Disabled Workers
Table 43.
Average primary insurance amount and average monthly benefit, by sex, selected years 1960–2009 (in dollars)
Year Average primary insurance amount Average monthly benefit
All
disabled
workers
Men Women All
disabled
workers
Men Women
1960 -- -- -- 91.20 94.00 78.90
1965 (Jan.–Aug.) -- -- -- 93.30 97.90 80.30
1965 (Sept.–Dec.) -- -- -- 101.30 106.50 86.80
1970 -- -- -- 139.80 148.40 115.70
1975 -- -- -- 241.20 263.80 190.90
1980 -- -- -- 406.30 449.40 308.50
1985 -- -- -- 475.60 530.40 363.70
1986 -- -- -- 473.80 531.50 357.40
1987 -- -- -- 506.00 573.20 381.60
1988 -- -- -- 297.40 321.20 263.50
1989 -- -- -- 562.10 634.40 429.90
1990 -- -- -- 594.20 667.90 465.80
1991 -- -- -- 605.50 685.20 470.60
1992 -- -- -- 621.90 699.80 494.20
1993 -- -- -- 639.80 720.10 507.70
1994 -- -- -- 672.80 757.70 535.00
1995 -- -- -- 687.70 786.90 549.00
1996 734.00 836.40 595.70 709.10 807.90 575.60
1997 752.00 855.40 623.50 728.10 824.00 608.80
1998 771.30 879.50 639.50 746.30 846.80 623.80
1999 813.20 922.30 674.70 787.80 890.70 657.10
2000 856.80 975.30 718.70 833.70 947.70 700.90
2001 891.60 1,019.60 739.00 867.70 989.30 722.60
2002 923.90 1,053.00 772.10 898.60 1,021.70 753.90
2003 963.10 1,096.70 805.90 937.50 1,064.90 787.60
2004 994.00 1,130.30 835.70 968.50 1,098.60 817.40
2005 1,026.40 1,164.30 867.20 1,001.50 1,133.30 849.30
2006 1,062.80 1,203.60 902.40 1,038.20 1,172.80 884.90
2007 1,079.10 1,219.30 919.20 1,053.50 1,187.50 900.70
2008 1,141.20 1,285.90 976.50 1,114.50 1,252.70 957.30
2009 1,145.00 1,285.90 981.50 1,119.90 1,255.00 963.10
SOURCES: Social Security Administration. For years before 2000, Annual Statistical Supplement to the Social Security Bulletin, based on the Master Beneficiary Record, various sampling rates; from 2000 to 2001, Annual Award and Termination Transaction file, 1 percent sample; data after 2001 are 100 percent data.
NOTES: Data exclude closed period awards in 2002 and 2003 and expedited reinstatement cases since 2002.
Benefits awarded before the December cost-of-living increase are converted to the December rates before averages are computed.
-- = not available.
CONTACT: Hazel P. Jenkins (410) 965-0164 or di.asr@ssa.gov.
Top of page. Table of contents.
Awards to Disabled Workers
Table 44.
Distribution, by diagnostic group, sex, and age, 2009
Diagnostic group Total Men Women
All
ages
Under 35 35–49 50–
FRA
All
ages
Under 35 35–49 50–
FRA
All
ages
Under 35 35–49 50–
FRA
Number
Total 970,696 123,582 285,843 561,271 521,424 66,226 143,671 311,527 449,272 57,356 142,172 249,744
Congenital anomalies 1,507 759 334 414 817 406 175 236 690 353 159 178
Endocrine, nutritional, and metabolic diseases 34,168 2,757 9,812 21,599 18,286 1,286 5,029 11,971 15,882 1,471 4,783 9,628
Infectious and parasitic diseases 10,440 1,646 4,867 3,927 7,069 1,084 3,438 2,547 3,371 562 1,429 1,380
Injuries 38,439 5,831 11,770 20,838 25,197 4,152 7,772 13,273 13,242 1,679 3,998 7,565
Mental disorders
Retardation 23,031 15,230 5,544 2,257 14,176 9,172 3,499 1,505 8,855 6,058 2,045 752
Other 193,350 53,062 76,277 64,011 94,352 28,777 34,648 30,927 98,998 24,285 41,629 33,084
Neoplasms 90,411 4,701 22,385 63,325 46,576 2,284 9,997 34,295 43,835 2,417 12,388 29,030
Diseases of the—
Blood and blood- forming organs 2,900 929 752 1,219 1,354 428 304 622 1,546 501 448 597
Circulatory system 100,007 3,087 20,524 76,396 68,179 1,659 13,053 53,467 31,828 1,428 7,471 22,929
Digestive system 21,827 1,921 7,307 12,599 12,731 838 4,044 7,849 9,096 1,083 3,263 4,750
Genitourinary system 20,434 2,795 6,950 10,689 12,631 1,521 4,314 6,796 7,803 1,274 2,636 3,893
Musculoskeletal system and connective tissue 303,035 14,832 82,681 205,522 152,370 6,893 40,262 105,215 150,665 7,939 42,419 100,307
Nervous system and sense organs 79,756 12,758 25,233 41,765 41,211 6,220 12,002 22,989 38,545 6,538 13,231 18,776
Respiratory system 37,938 1,141 7,195 29,602 19,696 447 3,173 16,076 18,242 694 4,022 13,526
Skin and subcu- taneous tissue 2,154 403 822 929 1,023 154 401 468 1,131 249 421 461
Other 2,016 323 705 988 1,000 167 334 499 1,016 156 371 489
Unknown 9,283 1,407 2,685 5,191 4,756 738 1,226 2,792 4,527 669 1,459 2,399
Percent
Total 100.0 100.0 100.0 100.0 100.0 100.0 100.0 100.0 100.0 100.0 100.0 100.0
Congenital anomalies 0.2 0.6 0.1 0.1 0.2 0.6 0.1 0.1 0.2 0.6 0.1 0.1
Endocrine, nutritional, and metabolic diseases 3.5 2.2 3.4 3.8 3.5 1.9 3.5 3.8 3.5 2.6 3.4 3.9
Infectious and parasitic diseases 1.1 1.3 1.7 0.7 1.4 1.6 2.4 0.8 0.8 1.0 1.0 0.6
Injuries 4.0 4.7 4.1 3.7 4.8 6.3 5.4 4.3 2.9 2.9 2.8 3.0
Mental disorders
Retardation 2.4 12.3 1.9 0.4 2.7 13.8 2.4 0.5 2.0 10.6 1.4 0.3
Other 19.9 42.9 26.7 11.4 18.1 43.5 24.1 9.9 22.0 42.3 29.3 13.2
Neoplasms 9.3 3.8 7.8 11.3 8.9 3.4 7.0 11.0 9.8 4.2 8.7 11.6
Diseases of the—
Blood and blood- forming organs 0.3 0.8 0.3 0.2 0.3 0.6 0.2 0.2 0.3 0.9 0.3 0.2
Circulatory system 10.3 2.5 7.2 13.6 13.1 2.5 9.1 17.2 7.1 2.5 5.3 9.2
Digestive system 2.2 1.6 2.6 2.2 2.4 1.3 2.8 2.5 2.0 1.9 2.3 1.9
Genitourinary system 2.1 2.3 2.4 1.9 2.4 2.3 3.0 2.2 1.7 2.2 1.9 1.6
Musculoskeletal system and connective tissue 31.2 12.0 28.9 36.6 29.2 10.4 28.0 33.8 33.5 13.8 29.8 40.2
Nervous system and sense organs 8.2 10.3 8.8 7.4 7.9 9.4 8.4 7.4 8.6 11.4 9.3 7.5
Respiratory system 3.9 0.9 2.5 5.3 3.8 0.7 2.2 5.2 4.1 1.2 2.8 5.4
Skin and subcu- taneous tissue 0.2 0.3 0.3 0.2 0.2 0.2 0.3 0.2 0.3 0.4 0.3 0.2
Other 0.2 0.3 0.2 0.2 0.2 0.3 0.2 0.2 0.2 0.3 0.3 0.2
Unknown 1.0 1.1 0.9 0.9 0.9 1.1 0.9 0.9 1.0 1.2 1.0 1.0
SOURCE: Social Security Administration, Annual Award and Termination Transaction file, 100 percent data.
NOTES: Data exclude expedited reinstatement cases.
Effective 2001, the Social Security Administration initiated a special review of 130,000 Supplemental Security Income (SSI) recipients who are potentially eligible for Social Security disability benefits because of earnings while receiving SSI. Many of these claims awarded since 2001 were for individuals under the age of 35 who were diagnosed with a mental disorder.
Starting with 2007, age is based on date of entitlement and not date of award. Entitlement can be retroactive and thus precede the date of award.
FRA = full retirement age.
CONTACT: Hazel P. Jenkins (410) 965-0164 or di.asr@ssa.gov.
Top of page. Table of contents.
Awards to Disabled Workers
Table 45.
Distribution, by monthly benefit and sex, 2009
Monthly benefit (dollars) All disabled workers Men Women
Number Percent Number Percent Number Percent
Total 970,696 100.0 521,424 100.0 449,272 100.0
Less than 100.00 4,004 0.4 2,137 0.4 1,867 0.4
100.00–199.90 6,445 0.7 2,559 0.5 3,886 0.9
200.00–299.90 20,042 2.1 7,441 1.4 12,601 2.8
300.00–399.90 28,326 2.9 10,542 2.0 17,784 4.0
400.00–499.90 33,055 3.4 12,125 2.3 20,930 4.7
500.00–599.90 35,184 3.6 13,014 2.5 22,170 4.9
600.00–699.90 56,710 5.8 20,926 4.0 35,784 8.0
700.00–799.90 94,166 9.7 36,151 6.9 58,015 12.9
800.00–899.90 90,067 9.3 37,841 7.3 52,226 11.6
900.00–999.90 84,107 8.7 39,255 7.5 44,852 10.0
1,000.00–1,099.90 76,211 7.9 38,744 7.4 37,467 8.3
1,100.00–1,199.90 67,888 7.0 37,193 7.1 30,695 6.8
1,200.00–1,299.90 59,428 6.1 34,911 6.7 24,517 5.5
1,300.00–1,399.90 51,749 5.3 32,487 6.2 19,262 4.3
1,400.00–1,499.90 44,039 4.5 29,319 5.6 14,720 3.3
1,500.00–1,599.90 37,400 3.9 25,827 5.0 11,573 2.6
1,600.00–1,699.90 31,841 3.3 22,825 4.4 9,016 2.0
1,700.00–1,799.90 27,350 2.8 20,078 3.9 7,272 1.6
1,800.00–1,899.90 30,087 3.1 22,536 4.3 7,551 1.7
1,900.00–1,999.90 33,522 3.5 26,105 5.0 7,417 1.7
2,000.00 or more 59,075 6.1 49,408 9.5 9,667 2.2
Average benefit (dollars) 1,119.90 1,255.00 963.10
SOURCE: Social Security Administration, Annual Award and Termination Transaction file, 100 percent data.
NOTES: Benefits awarded before the December cost-of-living increase are converted to the December rates before averages are computed.
Data exclude expedited reinstatement cases.
CONTACT: Hazel P. Jenkins (410) 965-0164 or di.asr@ssa.gov.
Top of page. Table of contents.
Awards to Disabled-Worker Families
Table 46.
Number, average primary insurance amount, and average monthly family benefit, by family composition, 2009
Family composition Number
of
families
Number
of
beneficiaries
Average
primary
insurance
amount
(dollars)
Average
monthly
family
benefit a
(dollars)
Percentage
of families
receiving
maximum
family
benefit b
Worker only
Men 411,761 411,761 1,308.80 1,277.80 11.0
Women 372,996 372,996 1,002.70 983.70 22.5
Worker with children
By sex of worker
Men 90,222 243,080 1,295.90 1,853.10 83.4
Women 74,781 199,963 997.70 1,350.20 87.2
By number of children
1 child 88,551 177,102 1,180.80 1,631.40 82.0
2 children 50,555 151,665 1,162.50 1,657.20 88.4
3 or more children 25,897 114,276 1,088.90 1,541.40 89.4
Worker with—
Spouse aged 62 or older c 7,614 15,264 1,713.40 2,041.10 8.1
Spouse aged 62 or older and 1 or more children 210 679 1,614.10 2,570.90 62.4
Spouse and 1 child 4,385 13,157 1,367.40 2,011.80 86.8
Spouse and 2 children 4,623 18,492 1,319.90 1,931.40 87.3
Spouse and 3 or more children 3,865 21,597 1,252.00 1,815.10 87.0
SOURCE: Social Security Administration, Annual Award and Termination Transaction file, 100 percent data.
NOTES: A family means beneficiaries entitled on one worker's account. The data may understate the number of families with dependents because records of awards to dependents made in a different calendar year are not available for inclusion.
Data exclude expedited reinstatement cases; they include beneficiaries whose benefits are being withheld.
a. Benefits awarded before the December cost-of-living increase are converted to the December rates before averages are computed.
b. Includes families and worker-only beneficiaries for whom the primary insurance amount is equal to the family maximum amount.
c. If the spouse is also entitled to a retired-worker benefit, only the benefit amount received as a spouse is included.
CONTACT: Hazel P. Jenkins (410) 965-0164 or di.asr@ssa.gov.
Top of page. Table of contents.
Awards to Disabled-Worker Families
Table 47.
Distribution, by family composition and age of worker, 2009
Family composition Total,
all ages
Under 30 30–34 35–39 40–44 45–49 50–54 55–59 60–FRA
Number
Worker only 784,757 61,508 24,290 34,133 58,403 98,192 165,607 205,314 137,310
Worker with—
Spouse
Aged 62 or older a 7,824 2 2 6 8 49 258 1,249 6,250
Child in care 12,873 1,103 1,416 2,146 2,363 2,116 1,904 1,253 572
Children
1 child 88,551 7,902 5,985 10,096 15,813 17,825 16,767 10,001 4,162
2 children 50,555 5,453 6,932 10,583 11,026 8,188 5,210 2,386 777
3 or more children 25,897 3,415 5,487 6,816 4,966 2,859 1,459 670 225
Families receiving maximum benefit b 281,623 49,333 24,325 34,443 41,421 41,899 42,826 33,162 14,214
Percent
Worker only 100.0 7.8 3.1 4.3 7.4 12.5 21.1 26.2 17.5
Worker with—
Spouse
Aged 62 or older a 100.0 c c 0.1 0.1 0.6 3.3 16.0 79.9
Child in care 100.0 8.6 11.0 16.7 18.4 16.4 14.8 9.7 4.4
Children
1 child 100.0 8.9 6.8 11.4 17.9 20.1 18.9 11.3 4.7
2 children 100.0 10.8 13.7 20.9 21.8 16.2 10.3 4.7 1.5
3 or more children 100.0 13.2 21.2 26.3 19.2 11.0 5.6 2.6 0.9
Families receiving maximum benefit b 29.0 62.1 55.1 54.0 44.7 32.4 22.4 15.0 9.5
SOURCE: Social Security Administration, Annual Award and Termination Transaction file, 100 percent data.
NOTES: A family means beneficiaries entitled on one worker's account. The data may understate the number of families with dependents because records of awards to dependents made in a different calendar year are not available for inclusion.
Data exclude expedited reinstatement cases; they include beneficiaries whose benefits are being withheld.
Starting with 2007, age is based on date of entitlement and not date of award. Entitlement can be retroactive and thus precede the date of award.
FRA = full retirement age.
a. Includes spouses aged 62 or older with children.
b. Includes families and worker-only beneficiaries for whom the primary insurance amount is equal to the family maximum amount.
c. Less than 0.05 percent.
CONTACT: Hazel P. Jenkins (410) 965-0164 or di.asr@ssa.gov.
Top of page. Table of contents.
Benefits Withheld from All Disabled Beneficiaries
Table 48.
Number, by reason for withholding benefit, December 2009
Reason All
beneficiaries
Workers and nondisabled dependents Widow(er)s Adult children of—
Workers Spouses Children
under
age 18
Students
aged
18–19
Disabled
workers
Retired
workers
Deceased
workers
Total 753,643 140,893 46,303 303,161 5,192 6,203 40,486 110,244 101,161
Address unknown 33,962 14,138 469 13,978 186 475 699 782 3,235
Determination of continuing disability pending 7,104 4,681 84 1,699 12 17 155 102 354
Recoupment of overpayment 17,396 7,529 792 7,639 181 357 139 232 527
Workers' compensation offset 5,840 2,241 317 3,092 81 . . . 109 . . . . . .
Payee not determined 6,273 1,929 1 2,906 19 26 127 208 1,057
Substantial gainful activity 50,028 35,244 757 11,926 66 129 834 354 718
Imprisoned or confined 53,159 42,453 239 223 13 224 1,727 1,357 6,923
Entitled child not in care 9,425 . . . 9,425 . . . . . . . . . . . . . . . . . .
Beneficiary earnings 20,059 . . . 20,024 30 5 . . . . . . . . . . . .
Earnings of the other beneficiaries 301 . . . . . . . . . . . . . . . . . . 301 . . .
Government pension offset 4,266 . . . 3,607 . . . . . . 659 . . . . . . . . .
Technical entitlement 489,608 . . . 8,900 248,749 4,286 3,599 34,279 105,298 84,497
Other 56,222 32,678 1,688 12,919 343 717 2,417 1,610 3,850
SOURCE: Social Security Administration, Disabled Beneficiaries and Dependents Master Beneficiary Record file, 100 percent data.
NOTES: These data represent the total number of beneficiaries with benefits withheld in December 2009 regardless of when their benefits were initially withheld.
. . . = not applicable.
CONTACT: Sheron M. Matthews (410) 966-4750 or di.asr@ssa.gov.
Top of page. Table of contents.
Benefits Terminated for All Disabled Beneficiaries
Table 49.
Number and rate, 1960–2009
Year Total Workers Widow(er)s Adult children
Number Rate Number Rate Number Rate Number Rate
1960 91,543 164 89,090 196 -- -- 2,453 24
1961 118,842 160 115,546 187 -- -- 3,296 27
1962 132,144 149 128,299 173 -- -- 3,845 26
1963 143,008 144 137,850 167 -- -- 5,158 31
1964 144,422 134 138,576 155 -- -- 5,846 32
1965 163,276 138 156,648 159 -- -- 6,628 33
1966 175,959 134 168,630 154 -- -- 7,329 34
1967 218,077 153 208,899 175 -- -- 9,178 40
1968 232,817 151 222,197 172 -- -- 10,620 44
1969 263,191 159 251,269 180 -- -- 11,922 46
1970 272,239 154 260,444 174 -- -- 11,795 44
1971 278,092 144 266,471 162 -- -- 11,621 41
1972 275,663 129 261,739 143 -- -- 13,924 46
1973 317,237 136 304,792 151 -- -- 12,445 39
1974 336,246 130 320,958 143 -- -- 15,288 45
1975 344,727 121 329,532 132 -- -- 15,195 42
1976 367,608 120 351,504 132 -- -- 16,104 42
1977 418,394 129 401,334 141 -- -- 17,060 42
1978 431,067 131 413,571 144 -- -- 17,496 42
1979 441,101 133 422,503 147 -- -- 18,598 43
1980 422,612 128 408,051 143 -- -- 14,561 32
1981 449,669 139 434,187 156 -- -- 15,482 33
1982 500,282 163 483,847 186 -- -- 16,435 35
1983 473,327 155 453,621 177 -- -- 19,706 40
1984 391,190 126 371,913 143 -- -- 19,277 38
1985 357,006 112 339,984 128 -- -- 17,022 32
1986 358,289 109 341,276 125 -- -- 17,013 31
1987 365,004 109 347,948 125 -- -- 17,056 30
1988 375,621 110 356,143 126 -- -- 19,478 34
1989 371,128 107 351,402 121 -- -- 19,726 34
1990 368,208 102 348,194 116 -- -- 20,014 33
1991 369,026 97 351,303 110 -- -- 17,723 29
1992 379,653 92 361,796 104 -- -- 17,857 28
1993 391,159 89 372,317 100 -- -- 18,842 29
1994 404,624 87 384,590 97 -- -- 20,034 30
1995 422,114 87 399,475 95 -- -- 22,639 33
1996 420,756 83 396,980 91 -- -- 23,776 34
1997 491,194 94 464,984 103 -- -- 26,210 37
1998 436,244 81 409,489 87 -- -- 26,755 38
1999 463,394 83 433,950 89 -- -- 29,444 41
2000 493,651 86 460,351 91 -- -- 33,300 46
2001 513,472 83 459,073 87 21,411 105 32,988 45
2002 535,465 82 479,364 87 21,379 103 34,722 47
2003 501,222 73 447,485 76 20,707 99 33,030 44
2004 525,418 73 470,017 76 23,572 112 31,829 42
2005 556,745 74 499,662 77 23,609 109 33,474 44
2006 569,146 73 511,128 75 23,599 107 34,419 44
2007 580,721 72 522,349 74 23,768 106 34,604 44
2008 627,423 74 563,314 76 26,109 114 38,000 44
2009 695,216 78 630,074 81 25,071 106 40,071 44
SOURCES: Social Security Administration. For years before 2000, Annual Statistical Supplement to the Social Security Bulletin, based on the Master Beneficiary Record, various sampling rates; for 2000, Social Security Disability Insurance Beneficiaries, 100 percent data, and Annual Termination file, 100 percent data; from 2001 to 2003, Disabled Beneficiaries and Dependents Master Beneficiary Record file, 100 percent data; beginning in 2004, Annual Award and Termination Transaction file, 100 percent data, and Disabled Beneficiaries and Dependents Master Beneficiary Record file, 100 percent data.
NOTES: The termination rate is the number of terminations per 1,000 beneficiaries in current-payment status.
Beginning in 2004, data include closed period awards.
-- = not available.
CONTACT: Sheron M. Matthews (410) 966-4750 or di.asr@ssa.gov.
Top of page. Table of contents.
Benefits Terminated for All Disabled Beneficiaries
Table 50.
Number, by reason for termination, 2009
Reason for termination All
beneficiaries
Workers and nondisabled dependents Widow(er)s Adult children of—
Workers Spouses Children
under
age 18
Students
aged
18–19
Disabled
workers
Retired
workers
Deceased
workers
Total 1,203,432 630,074 55,259 322,734 130,223 25,071 12,744 5,884 21,443
Death of beneficiary 253,068 222,008 1,773 709 57 7,073 810 4,036 16,602
Termination resulting from death of worker a 48,882 -- 6,575 37,521 1,453 -- 3,333 -- --
Attainment of age—
18 by children 232,047 -- -- 232,047 -- -- -- -- --
19 by students 23,266 -- -- -- 23,266 -- -- -- --
FRA by disabled workers 380,967 337,614 29,621 7,761 456 -- 5,515 -- --
FRA by disabled widow(er)s 17,071 -- -- -- -- 17,071 -- -- --
Elected reduced retirement 1,916 1,916 -- -- -- -- -- -- --
Termination of spouse's benefit because child attains age 16 11,863 -- 11,863 -- -- -- -- -- --
Marriage, remarriage, or divorce of beneficiary 4,080 -- 1,448 1,272 172 9 391 294 494
Entitlement to an equal or larger Social Security benefit 2,611 . . . 1,423 164 7 455 155 147 260
Does not meet medical standards b 120,225 52,858 2,192 41,923 15,750 229 2,272 1,174 3,827
Medical improvement c -- 20,369 -- -- -- 54 987 282 1,112
Work above substantial gainful activity d -- 32,445 -- -- -- 175 1,208 855 2,633
Miscellaneous reasons e -- 44 -- -- -- 0 77 37 82
Student no longer attending school 89,047 -- -- -- 89,047 -- -- -- --
Other 18,389 15,678 364 1,337 15 234 268 233 260
SOURCE: Social Security Administration, Annual Award and Termination Transaction file, 100 percent data.
NOTES: These data represent the total number of beneficiaries whose benefits were terminated during the calendar year regardless of the effective date of the termination.
Data include closed period awards.
. . . = not applicable; FRA = full retirement age; -- = not available.
a. Beneficiaries are terminated from the Disability Insurance Trust Fund and start receiving benefits from the Old-Age and Survivors Insurance Trust Fund.
b. Dependents' benefits terminate when the disabled worker no longer meets the requirements for disability benefits. Disabled widow(er)s and disabled adult children of deceased or retired workers lose their benefits when they no longer meet the requirements for disability benefits.
c. Includes beneficiaries who medically improved, who did not cooperate during the medical review, or whose whereabouts are unknown.
d. Excludes disabled beneficiaries whose monthly benefits have been suspended because the beneficiaries are engaging in substantial gainful activity during the extended period of eligibility.
e. Includes beneficiaries who did not comply with alcohol or drug abuse treatment programs or who refused vocational rehabilitation services.
CONTACT: Sheron M. Matthews (410) 966-4750 or di.asr@ssa.gov.
Top of page. Table of contents.
Benefits Terminated for All Disabled Beneficiaries
Table 51.
Number and rate, by state or other area, 2009
State or area Total Workers Widow(er)s Adult children
Number Rate Number Rate Number Rate Number Rate
All areas 695,216 78 630,074 81 25,071 106 40,071 44
Alabama 17,291 74 15,482 76 807 101 1,002 50
Alaska 1,041 81 977 84 35 129 29 27
Arizona 12,394 81 11,535 83 370 107 489 41
Arkansas 11,087 77 10,013 78 468 102 606 53
California 57,629 79 52,957 83 1,607 102 3,065 40
Colorado 7,625 78 7,063 80 225 118 337 43
Connecticut 6,659 76 6,014 81 177 110 468 41
Delaware 2,230 80 2,068 83 57 93 105 45
District of Columbia 974 71 882 74 29 127 63 43
Florida 44,417 87 41,135 90 1,440 113 1,842 43
Georgia 22,951 85 20,896 88 923 110 1,132 46
Hawaii 2,094 84 1,909 88 56 99 129 46
Idaho 3,330 81 3,040 83 109 120 181 49
Illinois 24,301 79 21,742 83 873 113 1,686 43
Indiana 15,598 77 13,951 80 621 113 1,026 47
Iowa 6,345 78 5,594 82 210 116 541 50
Kansas 5,902 78 5,304 81 199 110 399 50
Kentucky 15,449 71 13,664 72 849 109 936 49
Louisiana 12,554 78 11,015 82 601 96 938 46
Maine 4,037 66 3,651 68 132 98 254 44
Maryland 10,333 83 9,536 88 301 117 496 38
Massachusetts 14,323 70 12,970 72 357 97 996 45
Michigan 25,534 75 22,816 78 946 106 1,772 44
Minnesota 9,421 75 8,566 78 228 120 627 42
Mississippi 10,726 77 9,599 79 507 98 620 45
Missouri 16,828 77 15,184 80 665 106 979 47
Montana 2,345 83 2,119 85 77 122 149 54
Nebraska 3,505 79 3,152 83 95 104 258 50
Nevada 5,368 93 5,083 96 156 117 129 38
New Hampshire 3,176 72 2,907 73 89 114 180 49
New Jersey 16,686 81 15,285 86 476 110 925 39
New Mexico 4,541 73 4,159 75 153 108 229 43
New York 40,995 75 37,072 79 1,298 104 2,625 39
North Carolina 27,106 81 24,738 84 996 103 1,372 47
North Dakota 1,303 84 1,155 90 36 126 112 48
Ohio 26,726 78 23,708 82 1,103 110 1,915 46
Oklahoma 10,773 83 9,673 84 451 108 649 57
Oregon 8,205 79 7,579 83 246 103 380 38
Pennsylvania 30,831 75 27,658 78 1,164 110 2,009 43
Rhode Island 2,710 72 2,465 75 73 97 172 44
South Carolina 14,592 82 13,317 85 587 102 688 44
South Dakota 1,614 81 1,420 84 61 153 133 52
Tennessee 19,866 80 17,932 82 899 104 1,035 47
Texas 44,177 78 40,363 81 1,759 102 2,055 40
Utah 3,555 79 3,236 82 112 124 207 43
Vermont 1,554 69 1,403 72 52 109 99 40
Virginia 17,078 78 15,503 81 642 105 933 45
Washington 13,152 78 12,141 81 371 102 640 41
West Virginia 7,785 73 6,824 75 383 93 578 54
Wisconsin 11,777 73 10,554 77 328 109 895 44
Wyoming 1,093 86 1,005 89 28 105 60 54
Outlying areas
Puerto Rico 11,408 61 10,095 63 536 100 777 34
Other a 2,222 92 1,965 112 108 121 149 26
SOURCES: Social Security Administration, Annual Award and Termination Transaction file, 100 percent data, and Disabled Beneficiaries and Dependents Master Beneficiary Record file, 100 percent data.
NOTES: The termination rate is the number of terminations per 1,000 beneficiaries in current-payment status.
Data include closed period awards.
a. Includes American Samoa, Guam, Northern Mariana Islands, U.S. Virgin Islands, and foreign countries.
CONTACT: Sheron M. Matthews (410) 966-4750 or di.asr@ssa.gov.
Top of page. Table of contents.
Disabled Workers Who Work
Table 52.
Distribution of workers with benefits withheld because of substantial work, by diagnostic group and age, December 2009
Diagnostic group Total Under 30 30–39 40–49 50–59 60–FRA
Number
Total 35,244 3,571 6,861 10,326 10,793 3,693
Congenital anomalies 115 45 36 17 14 3
Endocrine, nutritional, and metabolic diseases 695 43 130 202 244 76
Infectious and parasitic diseases 883 25 147 394 279 38
Injuries 2,280 306 521 587 608 258
Mental disorders
Retardation 1,072 417 323 219 92 21
Other 10,836 1,322 2,709 3,514 2,772 519
Neoplasms 3,789 243 527 968 1,501 550
Diseases of the—
Blood and blood-forming organs 243 57 81 66 34 5
Circulatory system 1,547 52 169 314 615 397
Digestive system 894 56 121 241 368 108
Genitourinary system 1,378 147 337 464 350 80
Musculoskeletal system and connective tissue 6,841 177 680 1,961 2,769 1,254
Nervous system and sense organs 3,479 592 878 1,028 753 228
Respiratory system 506 28 75 129 195 79
Skin and subcutaneous tissue 86 4 20 31 25 6
Other 115 18 29 29 29 10
Unknown 485 39 78 162 145 61
Percent
Total 100.0 100.0 100.0 100.0 100.0 100.0
Congenital anomalies 0.3 1.3 0.5 0.2 0.1 0.1
Endocrine, nutritional, and metabolic diseases 2.0 1.2 1.9 2.0 2.3 2.1
Infectious and parasitic diseases 2.5 0.7 2.1 3.8 2.6 1.0
Injuries 6.5 8.6 7.6 5.7 5.6 7.0
Mental disorders
Retardation 3.0 11.7 4.7 2.1 0.9 0.6
Other 30.7 37.0 39.5 34.0 25.7 14.1
Neoplasms 10.8 6.8 7.7 9.4 13.9 14.9
Diseases of the—
Blood and blood-forming organs 0.7 1.6 1.2 0.6 0.3 0.1
Circulatory system 4.4 1.5 2.5 3.0 5.7 10.8
Digestive system 2.5 1.6 1.8 2.3 3.4 2.9
Genitourinary system 3.9 4.1 4.9 4.5 3.2 2.2
Musculoskeletal system and connective tissue 19.4 5.0 9.9 19.0 25.7 34.0
Nervous system and sense organs 9.9 16.6 12.8 10.0 7.0 6.2
Respiratory system 1.4 0.8 1.1 1.2 1.8 2.1
Skin and subcutaneous tissue 0.2 0.1 0.3 0.3 0.2 0.2
Other 0.3 0.5 0.4 0.3 0.3 0.3
Unknown 1.4 1.1 1.1 1.6 1.3 1.7
SOURCE: Social Security Administration, Disabled Beneficiaries and Dependents Master Beneficiary Record file, 100 percent data.
NOTES: These data represent the total number of beneficiaries with benefits withheld in December 2009 regardless of when their benefits were initially withheld.
FRA = full retirement age.
CONTACT: Sheron M. Matthews (410) 966-4750 or di.asr@ssa.gov.
Top of page. Table of contents.
Disabled Workers Who Work
Table 53.
Distribution of workers with benefits terminated because of successful return to work, by diagnostic group and age, 2009
Diagnostic group Total Under 30 30–39 40–49 50–59 60–FRA
Number
Total 32,445 2,769 6,948 10,195 9,297 3,236
Congenital anomalies 88 31 31 13 8 5
Endocrine, nutritional, and metabolic diseases 826 28 110 266 298 124
Infectious and parasitic diseases 1,069 17 218 495 278 61
Injuries 1,740 169 406 539 471 155
Mental disorders
Retardation 2,152 510 759 614 228 41
Other 10,841 1,020 2,699 3,644 2,836 642
Neoplasms 1,648 112 282 416 595 243
Diseases of the—
Blood and blood-forming organs 247 49 93 57 43 5
Circulatory system 1,326 34 132 283 528 349
Digestive system 616 28 93 175 246 74
Genitourinary system 1,140 83 317 380 280 80
Musculoskeletal system and connective tissue 5,808 123 585 1,780 2,265 1,055
Nervous system and sense organs 3,621 483 969 1,134 795 240
Respiratory system 427 24 76 114 142 71
Skin and subcutaneous tissue 86 5 23 38 17 3
Other 106 7 24 40 28 7
Unknown 704 46 131 207 239 81
Percent
Total 100.0 100.0 100.0 100.0 100.0 100.0
Congenital anomalies 0.3 1.1 0.4 0.1 0.1 0.2
Endocrine, nutritional, and metabolic diseases 2.5 1.0 1.6 2.6 3.2 3.8
Infectious and parasitic diseases 3.3 0.6 3.1 4.9 3.0 1.9
Injuries 5.4 6.1 5.8 5.3 5.1 4.8
Mental disorders
Retardation 6.6 18.4 10.9 6.0 2.5 1.3
Other 33.4 36.8 38.8 35.7 30.5 19.8
Neoplasms 5.1 4.0 4.1 4.1 6.4 7.5
Diseases of the—
Blood and blood-forming organs 0.8 1.8 1.3 0.6 0.5 0.2
Circulatory system 4.1 1.2 1.9 2.8 5.7 10.8
Digestive system 1.9 1.0 1.3 1.7 2.6 2.3
Genitourinary system 3.5 3.0 4.6 3.7 3.0 2.5
Musculoskeletal system and connective tissue 17.9 4.4 8.4 17.5 24.4 32.6
Nervous system and sense organs 11.2 17.4 13.9 11.1 8.6 7.4
Respiratory system 1.3 0.9 1.1 1.1 1.5 2.2
Skin and subcutaneous tissue 0.3 0.2 0.3 0.4 0.2 0.1
Other 0.3 0.3 0.3 0.4 0.3 0.2
Unknown 2.2 1.7 1.9 2.0 2.6 2.5
SOURCE: Social Security Administration, Annual Award and Termination Transaction file, 100 percent data.
NOTE: FRA = full retirement age.
CONTACT: Sheron M. Matthews (410) 966-4750 or di.asr@ssa.gov.
Top of page. Table of contents.
Disabled Workers Who Work
Table 54.
Average monthly benefit for workers with benefits withheld, by diagnostic group and age, December 2009 (in dollars)
Diagnostic group Total Under 30 30–39 40–49 50–59 60–FRA
Total 1,235.10 972.80 1,150.30 1,235.70 1,336.30 1,349.20
Congenital anomalies 994.60 871.00 1,033.40 1,175.80 991.30 1,372.00
Endocrine, nutritional, and metabolic diseases 1,120.40 995.70 1,141.00 1,090.10 1,127.60 1,213.20
Infectious and parasitic diseases 1,247.60 995.80 1,169.50 1,254.50 1,306.00 1,214.50
Injuries 1,343.10 1,124.60 1,335.40 1,358.20 1,427.20 1,385.50
Mental disorders
Retardation 842.50 829.30 867.80 867.10 755.20 839.90
Other 1,142.90 924.70 1,077.10 1,164.50 1,250.80 1,320.30
Neoplasms 1,452.30 1,107.80 1,368.50 1,440.40 1,532.60 1,486.80
Diseases of the—
Blood and blood-forming organs 1,228.60 988.60 1,174.30 1,317.20 1,539.50 1,561.00
Circulatory system 1,345.50 1,050.50 1,157.80 1,334.50 1,395.60 1,395.30
Digestive system 1,376.40 993.80 1,184.60 1,309.30 1,498.60 1,522.80
Genitourinary system 1,345.40 1,017.30 1,237.60 1,372.10 1,494.50 1,595.10
Musculoskeletal system and connective tissue 1,251.10 1,043.10 1,180.80 1,226.80 1,282.70 1,286.80
Nervous system and sense organs 1,202.40 1,007.80 1,173.70 1,223.00 1,332.90 1,295.00
Respiratory system 1,212.60 886.70 1,089.20 1,176.70 1,331.70 1,209.80
Skin and subcutaneous tissue 1,262.30 1,282.80 1,125.20 1,140.00 1,399.00 1,769.00
Other 1,225.80 937.50 1,123.90 1,271.40 1,352.80 1,539.40
Unknown 1,264.70 1,054.20 1,255.30 1,276.30 1,310.60 1,271.20
SOURCE: Social Security Administration, Disabled Beneficiaries and Dependents Master Beneficiary Record file, 100 percent data.
NOTE: FRA = full retirement age.
CONTACT: Sheron M. Matthews (410) 966-4750 or di.asr@ssa.gov.
Top of page. Table of contents.
Disabled Workers Who Work
Table 55.
Average monthly benefit for workers with benefits terminated, by diagnostic group and age, 2009 (in dollars)
Diagnostic group Total Under 30 30–39 40–49 50–59 60–FRA
Total 1,111.60 952.50 1,034.70 1,098.10 1,188.00 1,235.70
Congenital anomalies 1,019.70 807.20 1,019.10 1,430.40 1,169.20 1,033.40
Endocrine, nutritional, and metabolic diseases 1,059.80 959.80 1,032.60 1,026.80 1,066.30 1,161.90
Infectious and parasitic diseases 1,150.60 1,020.30 1,131.70 1,146.80 1,162.00 1,234.30
Injuries 1,232.40 1,118.10 1,148.60 1,240.70 1,307.80 1,318.50
Mental disorders
Retardation 833.00 839.90 820.50 815.40 912.60 801.00
Other 1,048.00 929.20 990.10 1,049.70 1,113.80 1,180.20
Neoplasms 1,381.80 1,111.80 1,290.30 1,398.20 1,439.90 1,442.00
Diseases of the—
Blood and blood-forming organs 1,161.10 1,089.60 1,068.90 1,203.40 1,387.50 1,146.60
Circulatory system 1,241.80 1,007.90 1,172.70 1,199.70 1,255.30 1,304.60
Digestive system 1,275.30 1,043.00 1,163.40 1,232.60 1,372.40 1,282.20
Genitourinary system 1,253.90 1,046.10 1,148.40 1,239.70 1,411.40 1,403.70
Musculoskeletal system and connective tissue 1,146.00 1,034.00 1,103.50 1,116.80 1,168.70 1,183.00
Nervous system and sense organs 1,112.30 967.30 1,071.70 1,092.80 1,206.70 1,347.80
Respiratory system 1,097.80 982.30 1,008.50 1,070.20 1,147.20 1,177.70
Skin and subcutaneous tissue 1,045.30 802.30 1,077.20 1,042.80 1,128.70 765.70
Other 1,203.30 1,018.80 1,188.60 1,065.00 1,442.10 1,273.30
Unknown 1,102.60 995.30 1,007.20 1,128.50 1,133.10 1,161.50
SOURCE: Social Security Administration, Annual Award and Termination Transaction file, 100 percent data.
NOTE: FRA = full retirement age.
CONTACT: Sheron M. Matthews (410) 966-4750 or di.asr@ssa.gov.
Top of page. Table of contents.
Disabled Workers Who Work
Table 56.
Distribution, by state or other area, 2009
State or area All workers, December Workers with benefits
withheld because of
substantial work, December
Workers with benefits
terminated because of
successful return to work,
calendar year
Number Percentage
of all
workers
Number Percentage
of all
workers
All areas 7,788,013 35,244 0.5 32,445 0.4
Alabama 204,570 486 0.2 636 0.3
Alaska 11,573 85 0.7 84 0.7
Arizona 138,395 875 0.6 821 0.6
Arkansas 128,369 373 0.3 361 0.3
California 639,263 4,111 0.6 3,442 0.5
Colorado 87,986 413 0.5 449 0.5
Connecticut 74,153 533 0.7 401 0.5
Delaware 24,936 143 0.6 148 0.6
District of Columbia 11,948 115 1.0 104 0.9
Florida 458,526 1,502 0.3 2,018 0.4
Georgia 236,869 515 0.2 1,204 0.5
Hawaii 21,698 150 0.7 108 0.5
Idaho 36,525 151 0.4 162 0.4
Illinois 262,225 1,330 0.5 1,316 0.5
Indiana 175,037 581 0.3 551 0.3
Iowa 68,425 350 0.5 286 0.4
Kansas 65,631 318 0.5 247 0.4
Kentucky 190,169 593 0.3 465 0.2
Louisiana 135,077 697 0.5 575 0.4
Maine 53,959 305 0.6 214 0.4
Maryland 108,605 556 0.5 740 0.7
Massachusetts 179,409 1,471 0.8 1,276 0.7
Michigan 293,302 904 0.3 959 0.3
Minnesota 109,473 653 0.6 598 0.5
Mississippi 121,217 297 0.2 322 0.3
Missouri 190,815 750 0.4 643 0.3
Montana 24,865 107 0.4 103 0.4
Nebraska 38,133 230 0.6 182 0.5
Nevada 52,776 325 0.6 329 0.6
New Hampshire 39,678 310 0.8 219 0.6
New Jersey 176,926 1,070 0.6 757 0.4
New Mexico 55,815 253 0.5 224 0.4
New York 470,786 3,172 0.7 2,114 0.4
North Carolina 296,116 732 0.2 919 0.3
North Dakota 12,873 65 0.5 68 0.5
Ohio 291,040 1,041 0.4 1,195 0.4
Oklahoma 114,708 452 0.4 323 0.3
Oregon 91,801 380 0.4 322 0.4
Pennsylvania 352,882 2,099 0.6 1,590 0.5
Rhode Island 32,963 197 0.6 135 0.4
South Carolina 156,502 276 0.2 433 0.3
South Dakota 16,867 78 0.5 85 0.5
Tennessee 217,955 427 0.2 649 0.3
Texas 499,731 2,557 0.5 1,933 0.4
Utah 39,318 229 0.6 211 0.5
Vermont 19,567 162 0.8 107 0.5
Virginia 190,962 751 0.4 722 0.4
Washington 150,082 942 0.6 731 0.5
West Virginia 91,273 320 0.4 237 0.3
Wisconsin 137,593 615 0.4 498 0.4
Wyoming 11,312 81 0.7 97 0.9
Outlying areas
Puerto Rico 159,775 85 0.1 89 0.1
Other a 17,559 31 0.2 43 0.2
SOURCES: Social Security Administration, Disabled Beneficiaries and Dependents Master Beneficiary Record file, 100 percent data, and Annual Award and Termination Transaction file, 100 percent data.
a. Includes American Samoa, Guam, Northern Mariana Islands, U.S. Virgin Islands, and foreign countries.
CONTACT: Sheron M. Matthews (410) 966-4750 or di.asr@ssa.gov.
Top of page. Table of contents.
Reinstatement Status for Disabled Workers
Table 57.
Distribution, by sex and age, 2009
Age All workers,
December
Workers with benefits withheld
because of substantial work,
December
Workers with benefits terminated
because of successful return
to work, calendar year
Number Percentage of
all workers
Number Percentage of
all workers
All disabled workers
Total 7,788,013 35,244 0.5 32,445 0.4
Under 30 223,537 3,571 1.6 2,769 1.2
30–39 648,743 6,861 1.1 6,948 1.1
40–49 1,567,231 10,326 0.7 10,195 0.7
50–59 3,067,800 10,793 0.4 9,297 0.3
60–FRA 2,280,702 3,693 0.2 3,236 0.1
Men
Subtotal 4,100,400 18,603 0.5 17,380 0.4
Under 30 127,466 2,175 1.7 1,749 1.4
30–39 330,769 3,673 1.1 3,971 1.2
40–49 807,770 5,311 0.7 5,358 0.7
50–59 1,602,095 5,473 0.3 4,639 0.3
60–FRA 1,232,300 1,971 0.2 1,663 0.1
Women
Subtotal 3,687,613 16,641 0.5 15,065 0.4
Under 30 96,071 1,396 1.5 1,020 1.1
30–39 317,974 3,188 1.0 2,977 0.9
40–49 759,461 5,015 0.7 4,837 0.6
50–59 1,465,705 5,320 0.4 4,658 0.3
60–FRA 1,048,402 1,722 0.2 1,573 0.2
SOURCES: Social Security Administration, Disabled Beneficiaries and Dependents Master Beneficiary Record file, 100 percent data, and Annual Award and Termination Transaction file, 100 percent data.
CONTACT: Sheron M. Matthews (410) 966-4750 or di.asr@ssa.gov.
Top of page. Table of contents.
Reinstatement Status for Disabled Workers
Table 58.
Number, by expedited reinstatement status, sex, and age, 2009
Expedited
reinstatement status
Total Men Women
All
ages
Under 35 35–49 50 or
older
All
ages
Under 35 35–49 50 or
older
All
ages
Under 35 35–49 50 or
older
Provisional 8,103 1,087 3,424 3,592 4,248 677 1,826 1,745 3,855 410 1,598 1,847
Reinstated 10,450 1,434 4,652 4,364 5,542 905 2,535 2,102 4,908 529 2,117 2,262
Not reinstated a 409 61 203 145 235 34 123 78 174 27 80 67
SOURCE: Social Security Administration, Annual Award and Termination Transaction file, 100 percent data.
NOTE: Total is not included because some beneficiaries whose cases are pending are not receiving provisional payments.
a. Data include medical recoveries and return to work.
CONTACT: Sheron M. Matthews (410) 966-4750 or di.asr@ssa.gov.
Previous: Beneficiaries Who Have Filed for Workers' Compensation or Public Disability Benefits. Top of page. Table of contents. Next: Outcomes of Applications for Disability Benefits.