Assessing the Performance of Life-Cycle Portfolio Allocation Strategies for Retirement Saving: A Simulation Study
Social Security Bulletin, Vol. 70, No. 1, 2010
This article examines the performance of four life-cycle portfolio allocation strategies through stochastic simulation based on observed U.S. asset returns during 1926–2008. Annual worker contributions to retirement savings accounts are based on the actual lifetime earnings histories maintained by the Social Security Administration for 12,871 workers born during 1915–1942. Each strategy's performance is evaluated primarily on the basis of the distributions of internal rates of return on investments calculated at the time of retirement. Comparisons are made with the performance of four other investment strategies that vary in terms of their exposure to stock and bond market risk. Life-cycle plans with larger portfolio weights assigned to equities have higher average returns, but those gains come at the cost of increased risk of infrequent bad outcomes.
The authors are with the Division of Economic Research, Office of Research, Evaluation, and Statistics, Office of Retirement and Disability Policy, Social Security Administration.
Acknowledgments: The authors thank Linda Del Bene for help in producing the article's tables and charts and Andrew Biggs, Clark Burdick, Sharmila Choudhury, Chris Chaplain, Jason Fichtner, Susan Grad, Dale Kintzel, Dean Leimer, Joyce Manchester, David Pattison, and Robert Triest for helpful comments at various stages of the work. Earlier versions of the article were presented at the annual meetings of the Southern Economic Association (November 2007) and the National Tax Association (November 2008)
The findings and conclusions presented in the Bulletin are those of the authors and do not necessarily represent the views of the Social Security Administration.
Introduction
| AWI | average wage index |
| IRR | internal rate of return |
| PCE | personal consumption expenditures |
| RSA | retirement savings account |
| S&P | Standard and Poor's |
| TIPS | Treasury Inflation-Protected Securities |
| TSP | Thrift Savings Plan |
Over the past decade, life-cycle funds have become popular investment vehicles for workers to accumulate assets to finance retirement. Younger investors who have long time horizons are often willing to bear more market risk in pursuit of higher expected returns. As workers age and their anticipated time remaining in the labor force declines, many retirement savers want to reduce risk in their portfolios. Life-cycle mutual funds are a means of achieving this objective at low cost to investors.
A life-cycle fund can be characterized as a pool of investment assets—often a "fund of funds"—that spans a range of underlying asset types representing different risk-return trade-offs. The fund's portfolio is rebalanced frequently to maintain current asset allocation targets, but those targets gradually evolve to ensure that the portfolio composition regularly shifts from more to less risky investments.1 The life-cycle fund's most conservative allocation is attained at a specified future year, hence the commonly used synonym "target-date fund." These funds have particular appeal for investors who, for whatever reason, do not want to actively manage their portfolios themselves—although it is possible to achieve similar results through active management.
The growing importance of defined-contribution employer pensions and other retirement savings accounts (RSAs) has increased the responsibility of workers to ensure adequate retirement income for themselves.2 The proliferation of life-cycle funds since the mid-1990s suggests that their combination of diversification, evolving asset allocation targets, automatic portfolio rebalancing, and ease of use has considerable appeal for many investors. Assets held in life-cycle mutual funds increased from $1 billion in 1996 to about $120 billion by the end of 2006 (Viceira 2009) and nearly 40 percent of 401(k) plans now offer a life-cycle option (Poterba and others 2006; Copeland 2009). That growth is likely to continue in part because the Pension Protection Act of 2006 facilitates the automatic enrollment in 401(k) plans of newly hired workers by sponsoring firms and designates life-cycle funds as an acceptable "default" option for new participants.3 In addition, President Obama's fiscal year 2010 budget proposes that at a yet-unspecified future date, employers who do not currently offer retirement plans be required to automatically enroll employees in direct-deposit individual retirement accounts (IRAs). The budget document suggests this will increase the savings participation rate for low- and middle-income workers from 15 to 80 percent (OMB 2009).
The popularity of life-cycle funds raises a number of questions about their performance relative to alternative approaches. In this article we simulate the performance of four life-cycle investment portfolio allocation strategies that vary in terms of risk exposure at any specific age. Simulations are conducted in a historical setting; that is, the results demonstrate what might have occurred had the investment strategies been pursued by workers during 1937–2003. Social Security Administration earnings histories for 12,871 workers born during 1915–1942 are used to generate annual contribution amounts that are invested in RSAs. The article's main results are generated by a series of stochastic simulations in which the joint distribution of historical annual asset returns during 1926–2008 is used to produce 1,000 alternative account accumulation paths for each sample member. Because the historical U.S. equity premium may be higher than future premiums, further simulations incorporate lower mean equity returns.
One distinctive aspect of the simulations is that annual contributions to investment accounts are determined by the worker's earnings each year. Actual lifetime earnings histories are more diverse and exhibit substantially more variability over the work life than the stylized versions that are often the basis for investment simulations. Final account accumulations depend not only on the sequence of investment returns, but on the flow of new contributions into the account. Our simulations produce distributions of accumulated real RSA balances and of associated internal rates of return (IRRs) calculated on the basis of the nonstochastic contribution streams. Because the sample of earnings histories is drawn from 28 birth cohorts, the distribution of simulated final real account balances is influenced to some extent by growth in average real earnings in the economy over time; that is, later cohorts tend to have higher earnings and, therefore, greater account contributions than earlier ones and are more likely to be found in the upper tail of the distribution of real final account balances. Although the article presents some information on simulated accumulations, RSA performance is more often assessed from a personal financial perspective that focuses on the IRR earned on the individual's RSA investments.
The article's analysis does not explicitly incorporate individual attitudes toward financial risk, which are critical in choosing an investment strategy. Thus, the results do not evaluate the relative attractiveness of alternative investment strategies that offer different risk-return tradeoffs. The article simply compares the performance (as measured by the distributions of IRRs) of alternative investment strategies with a set of benchmark returns. In reality, risk-averse investors would require the expected IRR on the account to fully compensate for any perceived risk associated with adopting a given strategy.
One of the main findings is that even if the favorable historical levels of U.S. equity returns are used in stochastic simulations of RSA performance, there is a substantial probability, varying from 8 percent to 14 percent, that the four life-cycle strategies examined will fail to achieve a 2.0 percent real IRR. As the benchmark rate increases from 2.0 to 2.9 percent, the probabilities that the four simulated life-cycle strategies will fail to reach the benchmark increase to values that range from 15 percent to 28 percent. Finally, if average future U.S. stock returns are lower than the historical experience, simulation results based on past returns will overstate the expected performance of life-cycle funds in future years. To address this point, the article includes results that assume that the real historical equity premium on U.S. stocks is reduced by 2.5 percentage points. In these simulations, the probability that life-cycle RSAs fail to attain a real IRR of 2.0 percent are found to be at least 22 percent for all four strategies; the 2.9 percent benchmark increases the probability of failure to at least 36 percent.
The article's results are relevant for a broad set of retirement savings plans including tax-advantaged IRAs and employer-provided 401(k) and 403(b) plans, as well as the types of private accounts that have sometimes been proposed as part of Social Security reform.
Simulating Life-Cycle Accounts
This section describes the four life-cycle accounts examined in this article, describes four alternative investment plans used for comparison purposes, summarizes the data used in the simulations, and explains the methods used to generate the results.
Accounts Simulated
Three of the four life-cycle plans are described in Shiller (2005). The three Shiller funds—conservative, baseline, and aggressive—allocate account balances between stocks and bonds. The stock component is a U.S. equity index fund that tracks the Standard & Poor's (S&P) 500 index, and the bond fund comprises half long-term federal Treasury bonds and half 6-month private sector money market instruments (commercial paper and certificates of deposit). The three funds allocate RSA balances as follows:
- Baseline life-cycle plan. Through age 29, this portfolio invests 85 percent of total value in equities, with the equity share declining linearly until it reaches 15 percent at age 60, where it remains thereafter. The remainder of the portfolio is invested in the bond fund.
- Conservative life-cycle plan. This plan is similar to the baseline strategy, but the equity percentage begins at 70 percent through age 29, and linearly declines to 10 percent at age 60.
- Aggressive life-cycle plan. Also similar to the baseline strategy, this plan's equity percentage begins at 90 percent through age 29 and declines linearly to 40 percent at age 60.
The fourth life-cycle strategy, the L plan, is a simplified version of the federal Thrift Savings Plan (TSP) life-cycle funds that were introduced in 2005.4 Each "L Fund" is a portfolio of investments in five core TSP funds that existed before 2005: the G Fund (U.S. government securities), F Fund (bond fund), C Fund (indexed large-cap equities), S Fund (indexed small- and medium-cap equities), and I Fund (indexed international equities from developed foreign countries). Each L Fund shifts the portfolio composition away from riskier equities toward safer bonds as the investor ages. The Income Fund is the most conservative of the L Funds and is the terminal allocation to which the other L Funds evolve. This article examines a modified version of the TSP approach, one that offers a new 40-year fund each year—in contrast with one every decade—which permits investors to choose a fund with a target date that exactly matches their expected year of retirement.5 The portfolio allocation of a 40-year L plan fund among the five core funds is shown in Table 1.6 Table rows show the portfolio allocation at the fund's start date and at the end of each designated period,7 and the annual percentage-point change in L plan allocations to each underlying fund during the ensuing 5 years. The initial allocation at inception is predominantly in equities, both domestic and foreign, with a combined share of 90 percent (that is, the combined total of C, S, and I Fund shares), with the remaining 10 percent in bonds (F Fund). During the first 5 years, the percentage of the portfolio in the G Fund increases by 1.0 percentage point per year, and the F Fund remains at 10 percent, while there are small annual declines in the holdings of the three stock funds. Note that in the final 15 years of the life of any L plan fund, the shift in allocation shares from equities to the low-risk G Fund accelerates.8
| Period | G Fund a | F Fund a | C Fund b | S Fund b | I Fund b | |||||
|---|---|---|---|---|---|---|---|---|---|---|
| Allocation | Prospective percentage point change per year | Allocation | Prospective percentage point change per year | Allocation | Prospective percentage point change per year | Allocation | Prospective percentage point change per year | Allocation | Prospective percentage point change per year | |
| Startup | 0.0 | 1.0 | 10.0 | 0.0 | 44.0 | -0.4 | 19.0 | -0.2 | 27.0 | -0.4 |
| Year 5 | 5.0 | 1.1 | 10.0 | -0.1 | 42.0 | -0.4 | 18.0 | -0.2 | 25.0 | -0.4 |
| Year 10 | 10.5 | 1.1 | 9.5 | -0.1 | 40.0 | -0.4 | 17.0 | -0.2 | 23.0 | -0.4 |
| Year 15 | 16.0 | 1.1 | 9.0 | -0.1 | 38.0 | -0.4 | 16.0 | -0.4 | 21.0 | -0.2 |
| Year 20 | 21.5 | 1.1 | 8.5 | -0.1 | 36.0 | -0.4 | 14.0 | -0.4 | 20.0 | -0.2 |
| Year 25 | 27.0 | 1.6 | 8.0 | -0.1 | 34.0 | -0.7 | 12.0 | -0.4 | 19.0 | -0.4 |
| Year 30 | 35.0 | 1.6 | 7.5 | -0.1 | 30.5 | -0.7 | 10.0 | -0.4 | 17.0 | -0.4 |
| Year 35 | 43.0 | 6.2 | 7.0 | -0.2 | 27.0 | -3.0 | 8.0 | -1.0 | 15.0 | -2.0 |
| Year 40 | 74.0 | . . . | 6.0 | . . . | 12.0 | . . . | 3.0 | . . . | 5.0 | . . . |
| SOURCES: Federal Retirement Thrift Investment Board and authors' assumptions. | ||||||||||
| NOTE: . . . = not applicable. | ||||||||||
| a. Bond fund. | ||||||||||
| b. Stock fund. | ||||||||||
Four other investment strategies are simulated for the purpose of comparison with the life-cycle portfolios:
- All stocks. This plan consists of an "all stocks, all of the time" approach. The portfolio is entirely invested in an indexed fund that tracks the S&P 500 Index.
- All bonds. This plan implements an "all bonds, all of the time" approach. To facilitate comparison with other strategies, the investment is assumed to be identical to that used in the bond component of the three Shiller plans: a fund consisting of one-half long-term federal Treasury bonds and one-half 6-month private sector money market instruments (commercial paper and certificates of deposit).
- 50-50 stock-bond. This strategy allocates 50 percent of the RSA's value to an indexed stock fund tracking the S&P 500 Index and 50 percent to Shiller's bond fund, with annual rebalancing.
- No-lose. As proposed by Martin Feldstein (2005), each year's RSA contribution is divided between U.S. Treasury Inflation-Protected Securities (TIPS) and an indexed stock fund that tracks the S&P 500. The TIPS fraction is determined by the amount that is necessary to preserve the real value of that year's RSA contribution up to age 62, allowing for administrative expenses charged to the account each year. The remainder of the annual contribution is invested in equities. Therefore, even in the event that the equity investments are worthless by age 62, the RSA balance will equal the real value of all contributions made during ages 22–61.
All eight of the accounts—four life-cycle and four comparison strategies—are assumed to entail annual administrative expenses equal to 0.3 percent of the account balance. That expense ratio is used by Shiller (2005) in his recent analysis of life-cycle strategies in the management of a personal retirement account option within a revised Social Security program. Feldstein (2005) uses a 0.4 percent expense ratio. Poterba and others (2006) use life-cycle fund expense ratios that are somewhat higher, with baseline, mid-expense, and high-expense ratios equal to 0.4, 0.74, and 1.20 percent of assets, respectively.
Data
The RSA simulations require two types of data: detailed earnings histories that generate the contribution flows into the accounts, and information on the rates of return for the investment assets.
Earnings histories. The simulations use a sample of 12,871 actual earnings histories for people born during 1915–1942 (that is, 28 birth cohorts). Cases are drawn from exact-matched versions of the Census Bureau's 1992 and 1993 panels of the Survey of Income and Program Participation (SIPP). Under a simple retirement savings scheme, workers' RSA contributions would be determined by their total labor market earnings, and ideally the simulations would use such data. This study uses Social Security taxable earnings for the years 1937–2003.9 Attention is restricted to earnings and hypothetical RSA contributions during ages 22–61, facilitating comparison of terminal account accumulations and IRRs at age 62, Social Security's earliest age of entitlement for retired-worker benefits. This restriction removes the potential effect of differences in timing of retirement on final account accumulations. The choice of cohorts is dictated by the decision to use earnings histories that are completed for ages 22–61; the oldest cohort attains age 22 in 1937, while the youngest cohort attains age 61 in 2003.
Among the 1915–1942 birth cohorts, there are many people with little or no Social Security taxable earnings. Low lifetime Social Security taxable earnings can result either from nonparticipation in the labor force or from employment in jobs that were not covered by the Social Security program. In either case, any simulated RSA accumulation would likely be small due to contribution streams with modest or zero value. Consequently, the study restricts the simulation sample to workers who are fully insured for their own Old-Age and Survivors Insurance (OASI) retired-worker benefits at age 62.10 Recipients of Social Security Disability Insurance benefits are also excluded from the sample because program rules strictly limit their earnings, in turn restricting the extent to which new RSA contributions can occur. These sample selection criteria, along with exclusion of the institutionalized population, the requirement that individuals survive at least until age 62, and the failure to match administrative data for some survey respondents, imply that the final simulation data set should not be considered generally representative of the population born 1915–1942. We claim simply that the RSA simulations are based on a large sample of earnings histories that exhibit realistic interperson variability for people who have had at least some moderate lifetime attachment to the work force.
Because RSA contributions in this study are mechanically determined by annual earnings, it is important to recognize that the earnings data are subject to censoring at OASI's annual maximum taxable earnings amount. In the current study, censored earnings amounts reduce RSA contributions relative to values that would be calculated in the absence of censoring. The extent to which annual earnings values are censored has changed over time as the amount of worker earnings subject to OASI payroll taxes has increased. This point is confirmed by both the increase in the ratio of the annual maximum taxable earnings to the Social Security Administration's Average Wage Index (AWI)11—which ranged from 1.0 to 1.7 during 1951–1978, then rose to about 2.5 during 1990–2003—and the decrease in the proportion of earners who reach the taxable maximum each year.12 To bring pre-1990 values of the ratio closer to the more recent values, we create alternative hypothetical maximum taxable earnings amounts for years prior to 1990 that are equal to about 2.5 times the AWI for each year. Any annual earnings figures that were censored at the historical taxable maximum amounts before 1990 are replaced by estimated values from the interval bounded by the actual historical taxable maximum and the estimated alternative taxable maximum.13 These adjustments to earlier censored earnings amounts reduce, but do not eliminate, a downward bias in estimated account contributions by higher earners. Although the RSA accumulations of high earners remain smaller than would be calculated if uncensored total earnings amounts were available for all years, the effect on IRR distributions would likely be small and less important than the annual administrative charges levied against the accounts. Summary sample statistics given in Table 2 convey information about the distribution of average annual (adjusted) real taxable earnings during ages 22–61 for the 28 cohorts used in the simulations.14
| Cohort | Counts (unweighted) | Real earnings (2004 dollars) | |||||||
|---|---|---|---|---|---|---|---|---|---|
| Men | Women | Mean | Median | Standard deviation | Minimum | 5th percentile | 95th percentile | Maximum | |
| 1915 | 122 | 112 | 15,155 | 11,844 | 10,735 | 1,144 | 2,633 | 36,889 | 42,788 |
| 1916 | 141 | 139 | 15,468 | 12,511 | 10,696 | 930 | 2,294 | 34,539 | 43,299 |
| 1917 | 160 | 128 | 16,352 | 15,340 | 10,731 | 853 | 2,088 | 36,036 | 43,047 |
| 1918 | 177 | 147 | 17,530 | 16,008 | 11,737 | 738 | 2,278 | 38,348 | 44,487 |
| 1919 | 177 | 168 | 16,590 | 13,670 | 11,948 | 974 | 2,473 | 37,475 | 46,319 |
| 1920 | 209 | 196 | 16,037 | 12,230 | 11,803 | 903 | 2,277 | 38,001 | 46,468 |
| 1921 | 186 | 191 | 16,938 | 13,407 | 12,389 | 1,123 | 2,644 | 39,980 | 47,166 |
| 1922 | 202 | 171 | 18,404 | 16,326 | 12,986 | 1,048 | 2,331 | 41,136 | 47,945 |
| 1923 | 224 | 202 | 18,264 | 16,426 | 12,577 | 628 | 2,443 | 39,817 | 48,584 |
| 1924 | 253 | 206 | 19,325 | 17,106 | 12,682 | 1,149 | 2,880 | 41,897 | 50,300 |
| 1925 | 251 | 204 | 20,272 | 18,352 | 13,367 | 1,260 | 2,774 | 43,321 | 52,192 |
| 1926 | 248 | 215 | 19,779 | 15,940 | 14,205 | 773 | 2,493 | 45,834 | 52,513 |
| 1927 | 253 | 191 | 19,895 | 17,150 | 13,915 | 785 | 2,596 | 44,368 | 51,773 |
| 1928 | 251 | 195 | 21,355 | 18,342 | 14,829 | 1,088 | 2,487 | 49,142 | 55,727 |
| 1929 | 228 | 203 | 20,566 | 17,819 | 13,730 | 575 | 2,872 | 45,233 | 54,076 |
| 1930 | 242 | 194 | 21,396 | 18,129 | 15,055 | 831 | 2,392 | 47,687 | 58,222 |
| 1931 | 230 | 233 | 21,208 | 19,135 | 14,549 | 941 | 2,507 | 46,969 | 56,711 |
| 1932 | 276 | 216 | 21,685 | 19,186 | 14,695 | 1,181 | 3,049 | 48,228 | 57,053 |
| 1933 | 259 | 213 | 21,973 | 19,375 | 14,809 | 1,024 | 2,772 | 48,105 | 58,525 |
| 1934 | 271 | 246 | 21,173 | 18,334 | 14,866 | 939 | 2,489 | 49,316 | 56,991 |
| 1935 | 262 | 229 | 22,362 | 18,356 | 15,498 | 1,088 | 3,331 | 50,738 | 59,202 |
| 1936 | 291 | 222 | 23,884 | 21,979 | 15,670 | 1,119 | 3,049 | 51,596 | 59,131 |
| 1937 | 276 | 292 | 22,726 | 19,829 | 15,630 | 1,222 | 2,935 | 52,138 | 62,315 |
| 1938 | 263 | 273 | 22,488 | 18,606 | 15,306 | 1,200 | 3,288 | 51,711 | 60,641 |
| 1939 | 298 | 266 | 23,549 | 20,684 | 15,567 | 1,178 | 3,371 | 52,160 | 61,968 |
| 1940 | 317 | 291 | 23,056 | 19,783 | 15,648 | 911 | 3,352 | 52,248 | 61,587 |
| 1941 | 351 | 319 | 24,450 | 21,731 | 16,532 | 1,022 | 3,084 | 55,281 | 63,863 |
| 1942 | 408 | 383 | 24,660 | 21,381 | 16,685 | 1,047 | 3,233 | 55,601 | 64,335 |
| All cohorts | 6,826 | 6,045 | 20,861 | 18,002 | 14,614 | 575 | 2,748 | 48,112 | 64,335 |
| SOURCE: Authors' calculations using Social Security Administration earnings records. | |||||||||
| NOTE: A person's average annual real earnings is the 40-year arithmetic mean of all Social Security taxable earnings during ages 22–61. Pre-1990 earnings are subject to the study's alternative taxable maximum. Each year's earnings amount is indexed using the Personal Consumption Expenditures (PCE) price index. | |||||||||
Investment returns and the equity premium. The simulations use historical annual return data for 1926–2008. Returns data for the specific assets held in the RSAs are sometimes unavailable for some years of the 83-year period, in which case it is necessary to splice together similar data. Details are given in the Appendix.
The three Shiller life-cycle plans hold alternative mixes of a large-cap U.S. stock fund (S&P Composite Index), long-term Treasury bonds, and money market funds (6-month commercial paper and certificates of deposit). The L plan holds large-cap (S&P Composite Index) and small- and medium-cap (Dow Jones Wilshire 4500 Completion Index) U.S. stock funds, an international stock fund (Morgan Stanley Capital Investment EAFE [Europe, Australasia, Far East] Index), U.S. bond market securities with maturities of more than 1 year (Barclays Capital—formerly Lehman Brothers—U.S. Aggregate [LBA] Index), and 1-month Treasury bonds. Nominal returns are converted to real returns using the implicit price deflator for Personal Consumption Expenditures (PCE).15 Summary statistics for real annual rates of return on investment assets are shown in Table 3.
| Asset | Arithmetic mean | Standard deviation | Minimum | Maximum | Geometric mean |
|---|---|---|---|---|---|
| C Fund (Standard & Poor's 500) | 8.6 | 20.2 | -37.5 | 53.3 | 6.6 |
| S Fund | 9.9 | 24.6 | -42.4 | 102.1 | 7.2 |
| I Fund | 7.1 | 21.8 | -43.5 | 76.9 | 4.9 |
| F Fund | 2.8 | 6.7 | -8.1 | 26.6 | 2.6 |
| G Fund | 0.9 | 3.8 | -9.4 | 13.9 | 0.9 |
| Shiller combined bond-money market fund | 2.5 | 6.3 | -8.7 | 21.7 | 2.3 |
| Shiller bond | 3.3 | 10.1 | -13.0 | 34.0 | 2.8 |
| Shiller money market | 1.8 | 4.2 | -9.1 | 15.4 | 1.7 |
| SOURCES: Ibbotson Associates; Shiller (2005); Global Financial Data; and authors' calculations using Federal Reserve Board data. See article Appendix for details. | |||||
| NOTE: Return statistics do not reflect administrative expenses. | |||||
The no-lose comparison strategy uses TIPS, which were first issued in 1997, and are currently issued in 5-, 7-, 10-, and 20-year maturities. As of August 14, 2009, the respective real yields for the four maturities were measured as 1.18, 1.52, 2.03, and 2.25 percent (Department of the Treasury 2009).16 Because the history of TIPS market returns is too short to provide a sufficient basis for simulations, all simulations in this article assume that the TIPS annual real rate of interest equals 2.2 percent throughout 1926–2008.17
A critical determinant of the performance of the various life-cycle investment strategies is the return on the equity components of the portfolios. There has long been a substantial equity premium18 for U.S. stock investors. In a widely cited paper, Mehra and Prescott (2003) note that the real equity premium's arithmetic mean was 6.9 percent during 1889–2000, considerably larger than those observed in the United Kingdom, France, Germany, or Japan during the later decades of the 20th century. The study notes that the U.S. equity premium has increased over time, averaging roughly 4.5 percent during the first half of the 20th century, but reaching 7.6 percent in the latter half. For our purposes, the main question is whether historical U.S. equity returns for 1926–2008 are indicative of future returns. Professional opinion is divided on this point. Two recent studies of life-cycle investment accounts have simulated pessimistic views of likely future stock market performance. In the first, Shiller (2005) notes that the median geometric real return on U.S. stocks during 1900–2000 was 7.0 percent, while a weighted average for 15 countries (including the U.S.) over the same period was 4.8 percent, and suggests that international experience may be a better guide to the future. Accordingly, Shiller adjusts the U.S. historical returns downward by 2.2 percentage points to 4.8 percent. Shiller then subtracts the geometric mean return on bonds, equal to 1.5 percent, resulting in an implied equity premium of 3.3 percent. In the other study, Poterba and others (2006) note that Ibbotson SBBI Classic Yearbook returns data on large-cap equities for 1926–2003 reflect an average annual equity premium of 6.4 percent. For some simulations they reduce the historical rates by 3.0 percentage points, lowering the equity premium to 3.4 percent.
Accordingly, we discuss results from stochastic simulations under two equity premium scenarios: simulations based on the historical real rates of return on equities—with an arithmetic mean approximately equal to 9.3 percent (and a geometric mean of 6.6 percent) in the 1926–2008 returns data for large-cap stocks—and simulations that reduce the real equity premium by 2.5 percentage points. The reduction is implemented by subtracting 2.5 percentage points from each annual return figure for both large- and small-cap U.S. equities.
Simulation Procedures
Annual contributions to accounts are assumed to equal to 9 percent of Social Security taxable earnings during ages 22–61.19 There are no preretirement withdrawals. The basis for assessing investment performance is the total account accumulation at retirement onset, which is assumed to occur at age 62 for all workers.20 Because final account accumulations are strongly influenced by lifetime real earnings that tend to increase from earlier to later birth cohorts, the discussion of results focuses on the investment account IRRs. The percentage of earnings contributed to RSAs will not affect the rate of return for accounts if that percentage is the same for all workers in all years.
This article presents results of three simulations based on annual rates of return on the assets held in the RSAs. The first (and main) simulation is stochastic and uses randomly selected sequences of returns drawn from the historical returns for 1926–2008. The second is a nonstochastic simulation that uses the actual historical sequence of asset returns during 1937–2003, the period represented by the earnings histories that generate the account contributions. The third is a stochastic simulation in which the real historical equity premium on U.S. stocks is reduced by 2.5 percentage points.
The simulation results are based on workers' earnings that incorporate all upward adjustments of censored pre-1990s earnings amounts. Contribution amounts are those made from earnings during ages 22–61, ignoring any earnings outside that age interval.21 For each of the 12,871 earners in the sample, 1,000 simulations are run for each investment strategy. The sequence of investment returns for each simulation is drawn from 1926–2008 investment returns data. To preserve any contemporaneous correlations in asset performance, a draw of a specific year's data includes all return figures for that year. Each simulation requires a sequence of 67 years of returns corresponding to the period 1937–2003, during which all of the 40-year earnings histories occur. The sequence is constructed by repeatedly drawing (with replacement) from 1 to 5 adjacent consecutive years of returns, with the exact number of years in each draw determined randomly. The process continues until the sequence of 67 years of returns is complete. This method was chosen to preserve at least some of any intertemporal correlations in asset performance. Results differ little from simulations in which the return sequences were constructed with single-year draws.
Results
Results for each of the three simulations are discussed below.
Main Simulation
Statistics for the main stochastic simulation are presented in Table 4 and Chart 1, which summarize the distributions of real IRRs for the four life-cycle investment strategies and the four comparison plans (all bonds, a 50-50 mix of stocks and bonds, all stocks, and no-lose).22 Note that the "mean IRR" herein is an arithmetic mean of 12.9 million geometric means. The bottom four rows of the upper panel of Table 4 show, for each investment strategy, the percentage of nearly 13 million simulated paths where the IRR fails to attain four benchmark rates. The easiest benchmark to meet is 0 percent: The investor avoids an outright loss of any of the lifetime real contributions to the account. Two other benchmarks (2.0 percent and 2.5 percent) were specified in the final report of the President's Commission to Strengthen Social Security (2001) as the offset rates for voluntary personal retirement account contributions funded by payroll taxes. The 2.9 percent figure is the 2009 Social Security Trustees' best projection (intermediate assumption) for the long-run real rate of interest (Board of Trustees 2009). The lower panel of Table 4 shows measures of spread, skewness, and kurtosis for the simulated IRR distributions.
| IRR statistic | Life-cycle plans | Comparison plans | ||||||
|---|---|---|---|---|---|---|---|---|
| Conservative | Baseline | Aggressive | L plan | All bonds | 50-50 | All stocks | No-lose | |
| Selected values for the frequency distribution (in percent) | ||||||||
| Arithmetic mean | 3.9 | 4.3 | 5.1 | 4.6 | 2.1 | 4.8 | 6.5 | 4.5 |
| Minimum value | -5.6 | -5.8 | -9.5 | -7.2 | -6.6 | -11.2 | -24.1 | 0.2 |
| 1st percentile | -0.2 | -0.1 | -0.2 | -0.4 | -1.6 | -0.2 | -3.2 | 0.9 |
| 10th percentile | 1.7 | 1.9 | 2.3 | 1.9 | 0.1 | 2.2 | 1.8 | 1.9 |
| 25th percentile | 2.8 | 3.1 | 3.7 | 3.3 | 1.0 | 3.4 | 4.1 | 2.8 |
| Median | 3.9 | 4.3 | 5.2 | 4.7 | 2.1 | 4.8 | 6.6 | 4.2 |
| 75th percentile | 5.0 | 5.5 | 6.6 | 6.0 | 3.2 | 6.1 | 9.0 | 5.9 |
| 90th percentile | 6.0 | 6.6 | 7.9 | 7.2 | 4.1 | 7.3 | 11.2 | 7.7 |
| 99th percentile | 7.6 | 8.5 | 10.2 | 9.2 | 5.8 | 9.4 | 14.8 | 10.8 |
| Maximum value | 13.2 | 13.7 | 17.8 | 13.9 | 12.3 | 19.5 | 32.0 | 15.0 |
| IRR < 0 | 1 | 1 | 1 | 2 | 9 | 1 | 4 | 0 |
| IRR < 2.0 | 14 | 11 | 8 | 11 | 48 | 9 | 11 | 11 |
| IRR < 2.5 | 21 | 16 | 11 | 15 | 60 | 13 | 14 | 20 |
| IRR < 2.9 | 28 | 22 | 15 | 20 | 69 | 17 | 16 | 27 |
| Distribution shape statistics | ||||||||
| Standard deviation | 1.7 | 1.8 | 2.2 | 2.1 | 1.6 | 2.0 | 3.7 | 2.3 |
| Interquartile range | 2.3 | 2.5 | 2.9 | 2.8 | 2.2 | 2.7 | 4.9 | 3.1 |
| Coefficient of variation | 43.58 | 42.58 | 42.79 | 44.73 | 76.07 | 42.57 | 57.66 | 50.05 |
| Coefficient of skewness | -0.13 | -0.09 | -0.08 | -0.13 | 0.04 | -0.09 | -0.27 | 0.75 |
| Coefficient of kurtosis | 0.11 | 0.10 | 0.12 | 0.05 | 0.08 | 0.35 | 0.62 | 0.31 |
| SOURCE: Authors' calculations using Social Security Administration earnings records. | ||||||||
| NOTES: Sample size = 12,871. Simulations per person = 1,000. | ||||||||
Distributions of real internal rates of return (IRRs) for stochastically simulated retirement savings accounts using 1926–2008 investment returns for 1915–1942 birth cohorts
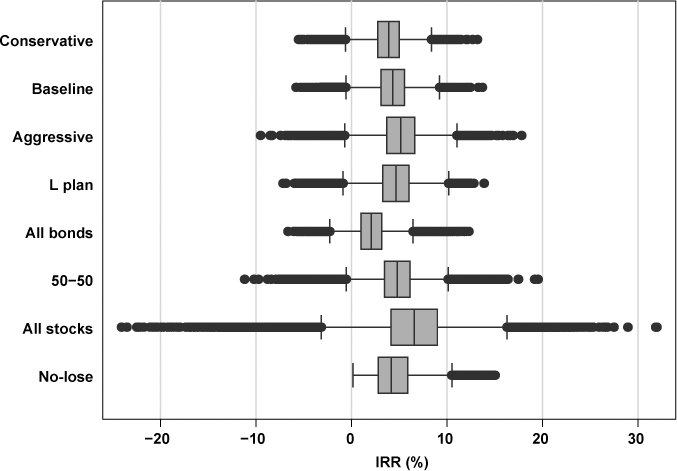
Text description for Chart 1.
Distributions of real internal rates of return (IRRs) for stochastically simulated retirement savings accounts using 1926–2008 investment returns for 1915–1942 birth cohorts
This chart is a box and whisker plot that provides a graphic representation of real internal rates of return distributions presented in Table 4. Endnote 23 describes the types of statistics displayed in this box and whisker plot.
In this chart, the horizontal (X) axis shows internal rates of return in percentages ranging from less than -20 percent to more than 30 percent. The vertical (Y) axis shows names of each of eight retirement savings account plans.
The box and whisker diagrams display the following internal rate of return statistics for each plan: minimum, 25th percentile, median, 75th percentile, and maximum values; the lower adjacent value, equal to the 25th percentile value minus one and one-half times the interquartile range; and the upper adjacent value, equal to the 75th percentile value plus one and one-half times the interquartile range. The interquartile range is equal to the difference between the 75th percentile and the 25th percentile values.
All values are given in Table 4 except for upper and lower adjacent values, which can be calculated from Table 4.
Among the four life-cycle investment strategies, both mean and median IRRs indicate that the aggressive plan generates the highest real returns (mean = 5.1 percent), followed by the L plan (mean = 4.6 percent), baseline plan (mean = 4.3 percent), and conservative plan (mean = 3.9 percent). This ordering of mean IRRs is associated with decreasing variability of returns as measured by their standard deviations. The distributions of outcomes for each strategy are displayed in Chart 1's box and whiskers plots.23,24 Differences in the distributions of IRRs for the four life-cycle strategies reflect differences in the exposure to higher-yielding but riskier assets (stocks) during ages 22–61. In some instances, the time path of the percentage of portfolio value invested in equities is always higher in one strategy than another (Chart 2). At any given age, the aggressive plan has more equity exposure than the baseline plan, which, in turn, is more equity-intensive than the conservative plan. Although the L plan also always contains a higher fraction of equities than the conservative plan, its time path intersects those of the aggressive and baseline plans, as well as those for the no-lose and 50-50 strategies (the 50-50 plan's path is the 50 percent gridline). Intersections of the time paths of two strategies can make it difficult to judge their relative equity exposure. For example, the L plan's equity exposure is most similar to the aggressive plan's but is actually a little lower during ages 23–40, higher during ages 41–58, and lower for ages 59–61.
Hypothetical portfolios: Percentage of contributions invested in stocks at ages 22–61
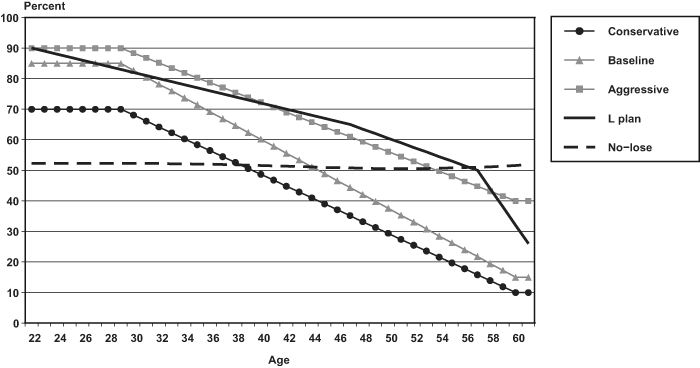
| Age | Conservative | Baseline | Aggressive | L plan | No-lose |
|---|---|---|---|---|---|
| 22 | 70 | 85 | 90 | 90 | 52.2594 |
| 23 | 70 | 85 | 90 | 89 | 52.2627 |
| 24 | 70 | 85 | 90 | 88 | 52.2867 |
| 25 | 70 | 85 | 90 | 87 | 52.2984 |
| 26 | 70 | 85 | 90 | 86 | 52.2992 |
| 27 | 70 | 85 | 90 | 85 | 52.2767 |
| 28 | 70 | 85 | 90 | 84 | 52.2666 |
| 29 | 70 | 85 | 90 | 83 | 52.2465 |
| 30 | 68.1 | 82.7 | 88.4 | 82 | 52.2345 |
| 31 | 66.1 | 80.5 | 86.8 | 81 | 52.2139 |
| 32 | 64.2 | 78.2 | 85.2 | 80 | 52.2087 |
| 33 | 62.3 | 76 | 83.5 | 79 | 52.1665 |
| 34 | 60.3 | 73.7 | 81.9 | 78 | 52.1354 |
| 35 | 58.4 | 71.5 | 80.3 | 77 | 52.0718 |
| 36 | 56.5 | 69.2 | 78.7 | 76 | 51.9923 |
| 37 | 54.5 | 66.9 | 77.1 | 75 | 51.9249 |
| 38 | 52.6 | 64.7 | 75.5 | 74 | 51.8064 |
| 39 | 50.6 | 62.4 | 73.9 | 73 | 51.6846 |
| 40 | 48.7 | 60.2 | 72.3 | 72 | 51.5633 |
| 41 | 46.8 | 57.9 | 70.6 | 71 | 51.4406 |
| 42 | 44.8 | 55.6 | 69 | 70 | 51.3297 |
| 43 | 42.9 | 53.4 | 67.4 | 69 | 51.2329 |
| 44 | 41 | 51.1 | 65.8 | 68 | 51.1073 |
| 45 | 39 | 48.9 | 64.2 | 67 | 50.9804 |
| 46 | 37.1 | 46.6 | 62.6 | 66 | 50.8924 |
| 47 | 35.2 | 44.4 | 61 | 65 | 50.7796 |
| 48 | 33.2 | 42.1 | 59.4 | 63.5 | 50.6861 |
| 49 | 31.3 | 39.8 | 57.7 | 62 | 50.6197 |
| 50 | 29.4 | 37.6 | 56.1 | 60.5 | 50.6005 |
| 51 | 27.4 | 35.3 | 54.5 | 59 | 50.5743 |
| 52 | 25.5 | 33.1 | 52.9 | 57.5 | 50.5758 |
| 53 | 23.6 | 30.8 | 51.3 | 56 | 50.6111 |
| 54 | 21.6 | 28.5 | 49.7 | 54.5 | 50.6796 |
| 55 | 19.7 | 26.3 | 48.1 | 53 | 50.7814 |
| 56 | 17.8 | 24 | 46.4 | 51.5 | 50.8935 |
| 57 | 15.8 | 21.8 | 44.8 | 50 | 51.0243 |
| 58 | 13.9 | 19.5 | 43.2 | 44 | 51.1967 |
| 59 | 11.9 | 17.3 | 41.6 | 38 | 51.3902 |
| 60 | 10 | 15 | 40 | 32 | 51.6299 |
| 61 | 10 | 15 | 40 | 26 | 51.9091 |
Differences in the distributions of IRRs between the L plan (mean = 4.6 percent, standard deviation = 2.1 percent) and the aggressive allocation plan (mean = 5.1 percent, standard deviation = 2.2 percent) reflect the types of stocks and bonds held by each plan. The large-cap stocks (C Fund) held by the aggressive plan have a slightly higher geometric mean rate of return (6.6 percent; see Table 3) than the L plan's mixture of C Fund, S Fund (small- and medium-cap), and I Fund (international) stocks, which is attributable to the lower (4.9 percent) geometric mean rate of return for the I Fund. The mix of long-term Treasury bonds and 6‑month private sector money market instruments held by the conservative, baseline, and aggressive plans (shown as the Shiller combined bond-money market fund in Table 3) also exhibits both a higher geometric mean rate of return (2.3 percent) and a higher standard deviation (6.3 percent) than the L plan's mix of long-term bonds (F Fund) and 1-month Treasury bills (G Fund).
The aggressive portfolio, which loses money for investors in 1 percent of the simulations, exceeds the other three benchmark IRR values with greater frequency than the other life-cycle strategies. When percentile values are compared for the distributions of simulated IRRs for the four life-cycle plans, the conservative plan, with its relatively greater emphasis on bonds, is almost always the worst performer.25
Among the four comparison plans, the simple all-stocks strategy produces a substantially higher mean IRR (6.5 percent) than any of the four life-cycle plans. In 17 percent of simulations, IRRs equal or exceed 10 percent, but there is a small probability (less than 3.5 percent) of generating the worst outcomes. The all-stocks portfolio has the highest variability (standard deviation) of outcomes, and generates a negative IRR in 4 percent of simulations, but attains the 2.0 percent, 2.5 percent, and 2.9 percent benchmarks more frequently than the life-cycle strategies, excepting the aggressive plan. The all-bonds portfolio generates the lowest mean IRR of the eight comparison and life-cycle strategies, and most frequently fails to generate returns that exceed all benchmarks.
The 50-50 plan has a mean IRR equal to 4.8 percent, which exceeds the mean IRRs of the life-cycle plans except the aggressive plan's 5.1 percent. The average equity exposure (Chart 2) during ages 22–61 is usually higher for the aggressive plan than for the 50-50 plan. The no-lose plan has a mean IRR equal to 4.5 percent, which exceeds those of the conservative and baseline plans and is about the same as the L plan's 4.6 percent. For the no-lose plan all persons have positive IRRs.
In general, the Table 4 results point to the importance of the benchmark rate of return chosen to evaluate an investment strategy. For the four life-cycle plans, between 8 and 14 percent of simulations fail to meet the 2.0 percent benchmark. If the benchmark is increased to 2.9 percent, the likelihood of a plan's IRR falling short is approximately doubled. Among the comparison plans, the IRR for the all-bonds strategy—by most criteria, the worst performer of all eight allocation strategies—fails to attain the 2.9 percent benchmark in 69 percent of the simulations.
The four life-cycle strategies and the 50-50 plan entail annual rebalancing of accounts. Rebalancing can increase or decrease account accumulations depending on the size of the difference in mean returns on assets held in the portfolio and the correlations among asset returns. Large differences in rates of return can result in markedly lower accumulations as funds are diverted from higher- to lower-return investments. When the correlation between returns is negative, rebalancing can increase accumulations. The stochastic simulation finds large penalties for the strategies that entail rebalancing. In the baseline and conservative strategies, mean IRRs are 25 percent lower when rebalancing occurs, with somewhat lower penalties for the L (22 percent), aggressive (15 percent), and 50-50 (8 percent) plans.26 The associated gains from rebalancing for these five strategies come via reductions in standard deviations of the distributions of IRRs of 23–40 percent.
A potential shortcoming of the stochastic simulation merits attention. It is possible that the simulation procedures somehow fail to construct return sequences that capture all the important statistical properties of the process that generates actual returns during 1926–2008 (for example, mean reversion). The procedure for constructing return sequences for the stochastic simulation ignores any correlation that may exist between equity returns and aggregate labor earnings growth. Geanakoplos and Zeldes (2009) argue that there is likely to be a long-run positive correlation between average wage levels and equity returns, yet there is currently no compelling empirical evidence on this point.
Nonstochastic Simulation with the Historical Sequence of Returns
In reality, some birth cohorts are more fortunate than others regarding asset returns during ages 22–61. In the stochastic simulation the large number of simulated return sequences for each investor effectively eliminates this phenomenon; draws of less favorable sequences tend to be offset by draws that reflect higher returns. To check the magnitude of this phenomenon, we divide the sample into seven cohort groups, each consisting of four consecutive birth years (1915–1918, 1919–1922, and so on through 1939–1942). We examine intercohort differences by conducting a nonstochastic simulation of seven of the portfolio allocation strategies using the actual historical sequence of investment returns for 1937–2003. (The no-lose strategy is omitted because there are no historical returns data for TIPS for nearly all of that period.) Although the probability of recurrence of this specific sequence of returns is effectively zero, the exercise offers the advantage that, by definition, it captures any cross-year correlations in returns, mean reversion, or other subtle statistical properties of asset returns imbedded in the historical returns data that may be omitted in the stochastic analysis.
The arithmetic mean IRRs and median final accumulations of the seven allocation strategies are shown for the seven cohort groups (separately and combined) in Table 5. There is wide variation in RSA performance across cohorts, irrespective of investment strategy. Relative differences in median accumulations across cohorts greatly exceed the differences in average real earnings reported in Table 2. The earliest two cohort groups (1915–1918 and 1919–1922) achieve considerably lower mean IRRs than do later groups, while the last two groups (1935–1938 and 1939–1942) fare notably better than the others. These intercohort differences in investment performance result in large differences in the probabilities that IRRs for specific strategies will attain the four benchmark returns. For example, probabilities that the 1919–1922 cohort group fails to meet the 2.0 percent return benchmark range from 6 percent (L plan) to 52 percent (conservative plan) to 100 percent for the all-bonds strategy. In contrast, the 1935–1938 and 1939–1942 cohorts always meet the 2.9 percent benchmark. The historical simulation confirms that some cohorts clearly fare worse in accumulating retirement savings irrespective of portfolio allocation strategy.
| Cohorts | Life-cycle plans | Comparison plans | |||||
|---|---|---|---|---|---|---|---|
| Conservative | Baseline | Aggressive | L Plan | All bonds | 50-50 | All stocks | |
| 1915–1918 | |||||||
| Median accumulation ($) | 66,274 | 72,054 | 78,676 | 79,920 | 48,870 | 66,755 | 92,023 |
| Mean IRR (%) | 1.9 | 2.4 | 3.0 | 3.1 | -0.2 | 1.9 | 3.8 |
| IRR standard deviation (%) | 1.0 | 1.3 | 1.4 | 1.1 | 0.4 | 1.0 | 2.0 |
| 1919–1922 | |||||||
| Median accumulation ($) | 71,354 | 79,281 | 89,928 | 97,328 | 48,510 | 73,793 | 111,292 |
| Mean IRR (%) | 1.8 | 2.4 | 3.1 | 3.6 | -0.3 | 2.1 | 4.2 |
| IRR standard deviation (%) | 1.1 | 1.3 | 1.3 | 0.9 | 0.8 | 0.8 | 1.4 |
| 1923–1926 | |||||||
| Median accumulation ($) | 113,200 | 125,465 | 141,905 | 146,651 | 83,412 | 118,773 | 172,514 |
| Mean IRR (%) | 3.6 | 4.0 | 4.6 | 4.8 | 2.0 | 3.9 | 5.5 |
| IRR standard deviation (%) | 0.8 | 0.8 | 0.9 | 0.7 | 0.9 | 0.8 | 1.0 |
| 1927–1930 | |||||||
| Median accumulation ($) | 134,838 | 146,079 | 165,654 | 179,345 | 104,315 | 150,516 | 212,987 |
| Mean IRR (%) | 4.2 | 4.5 | 5.1 | 5.5 | 2.8 | 4.8 | 6.4 |
| IRR standard deviation (%) | 0.6 | 0.6 | 0.7 | 0.6 | 0.7 | 0.8 | 1.0 |
| 1931–1934 | |||||||
| Median accumulation ($) | 156,971 | 165,735 | 188,631 | 186,921 | 127,476 | 182,759 | 246,339 |
| Mean IRR (%) | 4.6 | 4.9 | 5.5 | 5.4 | 3.5 | 5.4 | 6.8 |
| IRR standard deviation (%) | 0.6 | 0.7 | 0.8 | 0.5 | 0.7 | 0.8 | 1.0 |
| 1935–1938 | |||||||
| Median accumulation ($) | 199,953 | 216,043 | 278,282 | 246,719 | 151,936 | 281,882 | 479,565 |
| Mean IRR (%) | 5.3 | 5.7 | 6.9 | 6.3 | 4.0 | 6.9 | 9.3 |
| IRR standard deviation (%) | 0.7 | 0.7 | 1.0 | 0.7 | 0.6 | 1.2 | 1.7 |
| 1939–1942 | |||||||
| Median accumulation ($) | 233,064 | 251,847 | 299,063 | 270,855 | 174,137 | 282,677 | 408,782 |
| Mean IRR (%) | 5.7 | 6.0 | 6.7 | 6.2 | 4.3 | 6.5 | 8.1 |
| IRR standard deviation (%) | 0.5 | 0.6 | 0.7 | 0.5 | 0.5 | 0.8 | 1.3 |
| All cohorts | |||||||
| Median accumulation ($) | 136,463 | 149,193 | 173,036 | 172,530 | 101,684 | 155,507 | 229,788 |
| Mean IRR (%) | 4.2 | 4.6 | 5.3 | 5.2 | 2.7 | 4.9 | 6.7 |
| IRR standard deviation (%) | 1.6 | 1.5 | 1.7 | 1.3 | 1.8 | 2.0 | 2.2 |
| SOURCE: Authors' calculations using Social Security Administration earnings records. | |||||||
Stochastic Simulation with Reduced Equity Returns
A second set of stochastic simulation results, in which the real equity return for domestic stocks is lowered by 2.5 percentage points, is presented in Table 6. As expected, all distributions of simulated IRRs for the four life-cycle strategies and the three comparison plans that contain equity investments are substantially lower. The reduced equity premium results in standard deviations that are the same for the four life-cycle strategies, slightly larger for the all-stocks plan (by 0.2 percentage points) and the 50-50 plan (by 0.1 percentage points), and clearly smaller (by 0.5 percentage points) for the no-lose strategy. The mean IRR of the no-lose strategy declines relative to the mean IRRs of all other allocations except for all stocks, because equity exposure in the no-lose plan depends on the level of stock returns. In the no-lose strategy, the portfolio is not rebalanced and the reduced equity returns result in lower equity balances in subsequent years. Regardless of the portfolio strategy, investors fail to achieve returns of 2.0 percent on their RSAs at least 22 percent of the time. For six of the seven strategies that involve equities, the reduced equity premium at least doubles the percentage of simulated IRRs that fall short of 2.0 percent, with the percentage for the seventh (the conservative plan) increasing by 86 percent. Finally, the percentage of simulated IRRs that fall below 2.9 percent exceeds 40 percent for three of the seven strategies that involve stocks, and ranges from 36 percent to 45 percent for the four life-cycle funds.
| IRR statistic | Life-cycle plans | Comparison plans | ||||||
|---|---|---|---|---|---|---|---|---|
| Conservative | Baseline | Aggressive | L plan | All bonds | 50-50 | All stocks | No-lose | |
| Selected values for the frequency distribution (in percent) | ||||||||
| Arithmetic mean | 3.1 | 3.3 | 3.7 | 3.6 | 2.1 | 3.5 | 4.0 | 3.1 |
| Minimum value | -5.9 | -6.3 | -10.7 | -7.9 | -6.6 | -12.6 | -27.0 | 0.1 |
| 1st percentile | -0.9 | -1.0 | -1.6 | -1.4 | -1.6 | -1.6 | -6.3 | 0.5 |
| 10th percentile | 0.9 | 0.9 | 0.9 | 0.9 | 0.1 | 0.9 | -0.9 | 1.2 |
| 25th percentile | 2.0 | 2.1 | 2.2 | 2.2 | 1.0 | 2.2 | 1.5 | 1.8 |
| Median | 3.1 | 3.3 | 3.7 | 3.6 | 2.1 | 3.5 | 4.1 | 2.8 |
| 75th percentile | 4.2 | 4.5 | 5.1 | 5.0 | 3.2 | 4.9 | 6.6 | 4.1 |
| 90th percentile | 5.1 | 5.5 | 6.4 | 6.2 | 4.1 | 6.1 | 8.8 | 5.6 |
| 99th percentile | 6.8 | 7.4 | 8.7 | 8.1 | 5.8 | 8.2 | 12.4 | 8.4 |
| Maximum value | 12.8 | 13.2 | 16.7 | 13.2 | 12.3 | 18.3 | 29.6 | 12.6 |
| IRR < 0 | 4 | 4 | 5 | 5 | 9 | 5 | 14 | 0 |
| IRR < 2.0 | 26 | 24 | 22 | 22 | 48 | 22 | 29 | 31 |
| IRR < 2.5 | 36 | 33 | 29 | 30 | 60 | 30 | 33 | 44 |
| IRR < 2.9 | 45 | 41 | 36 | 37 | 69 | 38 | 37 | 54 |
| Distribution shape statistics | ||||||||
| Standard deviation | 1.7 | 1.8 | 2.2 | 2.1 | 1.6 | 2.1 | 3.9 | 1.8 |
| Interquartile range | 2.2 | 2.4 | 2.9 | 2.7 | 2.2 | 2.7 | 5.0 | 2.3 |
| Coefficient of variation | 54.17 | 54.76 | 59.61 | 57.72 | 76.07 | 58.75 | 97.85 | 56.96 |
| Coefficient of skewness | -0.10 | -0.07 | -0.06 | -0.12 | 0.04 | -0.10 | -0.34 | 1.03 |
| Coefficient of kurtosis | 0.09 | 0.08 | 0.12 | 0.03 | 0.08 | 0.35 | 0.74 | 1.03 |
| SOURCE: Authors' calculations using Social Security Administration earnings records. | ||||||||
| NOTES: Sample size = 12,871. Simulations per person = 1,000. | ||||||||
Reconciliation with Other Research
Our results are generally consistent with those in several recent studies that have explicitly considered the variability of investor returns on stocks and bonds. The two most relevant comparison studies are Shiller (2005), the source of three of our simulated life-cycle allocation strategies, and Poterba and others (2006).27
Shiller (2005) reports on the life-cycle strategies that we designate conservative, baseline, and aggressive plans, along with three comparison strategies (all stocks, all bonds, and a 50-50 plan). In Shiller's simulations, workers contribute to RSAs during ages 21–64. The investment returns used in the central results are 91 sets of consecutive 44-year sequences of the historical returns from 1871–2004, a considerably longer period than ours. As in our simulations, administrative charges for RSAs are assumed to be 0.3 percent of annual account balances.
All results presented in the previous section are based on the actual earnings histories, with minor adjustments, of 12,871 workers. In contrast, the Shiller simulations use a single hypothetical earnings history for a "scaled medium worker" developed by Social Security's Office of the Chief Actuary.28 The scaled medium worker's earnings history represents a hypothetical worker whose earnings during ages 21–64 are about equal to average earnings in the economy (measured by AWI) for the relevant years, with adjustments to reflect the worker's age. The worker's annual earnings relative to AWI increase until the worker's age reaches the late 40s, and then gradually decline. Shiller's hypothetical worker is born in 1990 and retires at age 65. As a consequence of using a single hypothetical worker's earnings history, any differences in account performance across simulation runs in the Shiller analysis cannot be due to variability in contribution streams and must stem from differences in the sequences of investment returns that are used. We return to this point below.
Several of the key statistics from our stochastic simulations based on historical returns are compared with Shiller's results in Table 7. There are a number of common findings: For example, the studies find the same rankings by size of mean IRR for the six allocation plans common to both analyses, and both studies find that the all-bonds plan performs worst in attaining IRR benchmarks. However, the stochastic simulation in our work produces a substantially wider distribution of outcomes for the six common strategies, as can be verified by comparing the 10th, 25th, 75th, and 90th percentile IRR values. For each of the six plans the mean IRR is higher in our study than in the Shiller study.
| IRR statistic | Life-cycle plans | Comparison plans | ||||||||||
|---|---|---|---|---|---|---|---|---|---|---|---|---|
| Conservative | Baseline | Aggressive | All bonds | 50-50 | All stocks | |||||||
| This study | Shiller | This study | Shiller | This study | Shiller | This study | Shiller | This study | Shiller | This study | Shiller | |
| Mean | 3.9 | 2.9 | 4.3 | 3.4 | 5.1 | 4.4 | 2.1 | 1.2 | 4.8 | 4.0 | 6.5 | 6.1 |
| 10th percentile | 1.7 | 1.9 | 1.9 | 2.4 | 2.3 | 3.2 | 0.1 | -0.3 | 2.2 | 2.4 | 1.8 | 4.1 |
| 25th percentile | 2.8 | 2.3 | 3.1 | 2.9 | 3.7 | 3.8 | 1.0 | -0.1 | 3.4 | 3.4 | 4.1 | 5.0 |
| Median | 3.9 | 2.7 | 4.3 | 3.4 | 5.2 | 4.6 | 2.1 | 1.1 | 4.8 | 4.2 | 6.6 | 5.9 |
| 75th percentile | 5.0 | 4.1 | 5.5 | 4.4 | 6.6 | 5.2 | 3.2 | 2.8 | 6.1 | 5.0 | 9.0 | 8.3 |
| 90th percentile | 6.0 | 4.2 | 6.6 | 4.5 | 7.9 | 5.3 | 4.1 | 3.0 | 7.3 | 5.2 | 11.2 | 8.6 |
| IRR < 2.0 | 14 | 13 | 11 | 2 | 8 | 1 | 48 | 68 | 9 | 4 | 11 | 0 |
| IRR < 2.9 a or 3.0 b | 28 | 56 | 22 | 32 | 15 | 8 | 69 | 89 | 17 | 20 | 16 | 2 |
| SOURCES: Authors' calculations using Social Security Administration earnings data (see Table 4) and Shiller (2005). | ||||||||||||
| a. Benchmark used in this study. | ||||||||||||
| b. Benchmark used in Shiller (2005). | ||||||||||||
We investigated the source of these differences. Historical real stock returns exhibit a geometric mean of 6.8 percent during the 1871–2004 reference period for the Shiller study and a geometric mean of 6.6 percent during the 1926–2008 reference period for our study. There is a modest difference in bond returns in the two studies, with Shiller reporting a geometric mean equal to 2.6 percent compared with 2.3 percent for this study. Our simulation procedures cause the arithmetic means of the distributions of the stochastically generated stock and bond returns to approximate their historical geometric means, but Shiller's simulations undersample years at both ends of his reference period.29 The uneven sampling of annual returns for 1871–2004, along with assumed administrative charges, lead to a reported mean IRR for Shiller's all-bonds strategy equal to 1.2 percent—considerably lower than the reported historical geometric mean would suggest—while the mean IRR for the all-stocks strategy is 6.1 percent, also lower than the geometric mean for the historical period.
Shiller also presents simulation results with an equity return reduced by 2.2 percentage points, analogous to our stochastic simulation based on an equity premium reduction of 2.5 percentage points (Table 6). In these simulations, findings common to both studies parallel the similarities mentioned above for the simulations without equity premium reductions. Again, both studies rank the six plans identically in terms of mean IRR and find that the all-bonds plan performs worst compared to the benchmark rates of return, and our stochastic simulation produces a markedly wider distribution of outcomes for all portfolio strategies.
In their main simulations, Poterba and others (2006) present results for eight asset allocation strategies, several of which bear some resemblance to ours. However, numerous differences in respective approaches render a comparison of their results with ours problematic. Their analysis is focused on accumulated balances and the utility levels attained by 1,400 married couples when alternative investment strategies are chosen for RSAs. Asset accumulation statistics are displayed only by education level, which roughly stratifies the sample by wealth levels.30 Their portfolio allocation strategies include all-stocks, all-bonds (nominal long-term), and all-TIPS plans; four life-cycle strategies; and Feldstein's no-lose plan.31 Of their four life-cycle plans, two represent a mix of large-cap indexed stock funds and TIPS, and two combine large-cap indexed stock funds with traditional long-term government bonds. The four life-cycle funds are differentiated by two factors: the rule for deciding the percentage of the portfolio in equities, and whether the remainder of the portfolio is invested in TIPS or government bonds. Regarding the portfolio's equity share, the rule is either "heuristic" (share = 110 – age) or "empirical" (the share at given ages is determined by the average value used by a set of leading investment firms that offer these types of funds). The empirical rule dictates a higher proportion of stock in the portfolio until a person is in his or her mid-50s, ranging from 88 percent at age 26 to 30 percent at age 63; the corresponding shares for the heuristic rule are 84 percent and 47 percent. In the 1926–2003 period used to generate the stochastic sequences of investment returns, the arithmetic mean real return is 9.2 percent for equities and 2.8 percent for bonds. A constant real return of 2.0 percent is assumed for TIPS.
Using historical rates of return in the stochastic simulations, Poterba and others (2006) report that at all education levels, the highest mean account accumulation is earned by the all-stocks strategy, which also displays the highest variability in outcomes. The no-lose strategy provides the next best mean accumulation and eliminates the possibility of the worst outcomes from the all-stocks plan. The no-lose strategy outperforms all four life-cycle plans, of which the best performer is empirical-bonds, followed by empirical-TIPS, heuristic-bonds, and heuristic-TIPS. The ranking of the performance of the four life-cycle plans is easy to explain. Plans that are more equity-reliant generate higher mean returns at the cost of more risk exposure, and the mean real bond return exceeds the assumed TIPS return of 2.0 percent.
Poterba and others (2006) also examine the effects of a 3.0 percentage point reduction in the equity premium, obtaining results that are consistent with ours. Mean all-stocks accumulations are approximately halved and the more an allocation strategy relies on equity investments, the greater the reduction in simulated account accumulations.
Simulation studies that compare the effectiveness of alternative investment strategies are sometimes based on the earnings of one or more stylized workers that are intended to represent some larger group's experience. The studies by Shiller (2005) and Brady (2009) are examples of that approach. In reality, the distribution of outcomes for an investment strategy depends both on the return sequences faced by investors and the stream of contributions to the accounts. We conducted a number of experiments to determine the effect of using earnings microdata on the stochastic simulation results. This involved substituting stylized earnings histories (for scaled medium workers) for the 12,871 actual earnings histories that determine account contributions in the simulations. Comparisons of results show that the earnings microdata have modest effects on the distributions of IRRs for life-cycle plans, reducing mean values and increasing standard deviations. In the earliest (1915) cohort, the mean IRRs of the four life-cycle strategies are 0.3 to 0.4 percentage points lower when actual earnings histories are used; later birth cohorts show smaller differences (about 0.1 percentage point). The standard deviations for the distributions of IRRs are usually 5 percent to 15 percent larger than for the stylized worker approach (except for the no-lose plan) and outcomes fail to meet the 2.9 percent return benchmark with slightly greater frequency (except for the all-bonds plan).
The use of earnings microdata has substantially larger effects on the distributions of total accumulations, producing smaller means and greater variability. Accumulations are 26 to 36 percent lower for the earliest cohort (1915), and are 7 to 16 percent lower for later cohorts. Differences are smallest for the all-bonds strategy and highest for all stocks. Dispersion in the distributions is substantially higher, with standard deviations ranging from 7 percent to 141 percent higher when microdata are used.
Much of the discrepancy in results for simulations that use earnings microdata versus those for stylized workers is associated with the prevalence of zero-earnings years. The four life-cycle strategies allocate smaller percentages of their portfolios to stock as age increases. The prevalence of zero-earnings years at younger ages means that final RSA accumulations do not benefit from early exposure to assets with higher expected returns, albeit with greater risk. The relative frequency of zero-earnings years and the importance of their effect on accumulations decline from earlier to later birth cohorts.32
Concluding Remarks
The stochastic simulation results presented in this article indicate that the four life-cycle portfolio allocation strategies offer investors mean real IRRs on the order of 4–5 percent, but entail probabilities ranging from 8 percent (aggressive) to 14 percent (conservative) that returns net of administrative expenses will fail to attain 2.0 percent. Only the extreme tails of the distributions of outcomes contain double digit returns; for three of the life-cycle strategies, they occur above the 99.5th percentile; for the fourth, the aggressive strategy, they occur above the 98.5th percentile. Life-cycle plans with larger portfolio weights assigned to stocks have higher average returns, but those gains come at the cost of increased risk of infrequent but very bad outcomes. By comparison, a portfolio invested entirely in stocks has a higher mean IRR than is found for any of the life-cycle plans—1.4 percentage points higher than the aggressive portfolio—but comes with the greatest variability in returns. The all-stocks simulations show double-digit IRRs in 17 percent of outcomes, but also have negative IRRs 4 percent of the time.
The relative attractiveness of the various RSA allocation strategies very much depends on whether historical returns on U.S. equities indicate what may be expected in the future. Professional opinion is divided on this point but at present appears to lean toward a reduced equity premium. A downward adjustment of 2.5 percent (real) in the equity return for U.S. stocks substantially lowers the mean IRR of simulated RSAs for the seven investment strategies that contain equity components. The relative risk (measured by the proportional change in the coefficient of variation) of the all-stocks strategy increases by 70 percent when the historical equity premium is reduced.
The Feldstein no-lose strategy performs quite well in comparison with the conservative and baseline life-cycle plans and has a mean IRR only 0.1 percentage point lower than that of the L plan. The no-lose plan generates lower IRRs than the aggressive plan in all except the lowest 10 percent of outcomes, but would appear to have considerable appeal for investors willing to accept a lower expected return (by about 0.6 percentage points compared with the aggressive plan) to avoid a low-probability loss. Whether this would become a popular investment strategy would very much depend on the real rate of interest paid by TIPS and the administrative costs that would be charged to investors. The TIPS market is still relatively new and evolving so there is not yet a great deal of evidence available.
This study's results do not lead to any sweeping conclusion about the desirability of adopting a life-cycle approach to manage retirement savings accounts. The rapid rise in the use of life-cycle funds over the past two decades suggests that the concept has considerable appeal for many workers. Nonetheless, the performance of equity investments in 2007–2008 and, more generally, over much of the past decade has raised concerns about whether investors understand the extent of risk to which their retirement savings can be exposed during their later working years. In this article, two of the four life-cycle plans (aggressive and L plan) have at least 50 percent of the RSA value allocated to equities after age 50. Bodie and Treussard (2007) note the popularity of life-cycle funds that more or less implement the simple rule that the proportion of equities held in a portfolio is equal to 100 – age. They conclude that workers who are more risk-averse and those with more uncertain future earnings potential are better served by RSA strategies that are less risky than the typical life-cycle plan (for example, the purchase of deferred real annuities). Thus, although life-cycle funds may constitute an improvement on the often inappropriate retirement saving strategies currently used by many workers, they may not be the best choice in many cases.
Appendix: Returns Data Used in Retirement Savings Account Simulations
Data sources are provided below for each type of RSA simulated in this article.
L Plan
For the indexed stock funds (C, S, and I) and the bond funds (F and G) held by the L plan, annual nominal rates of total return were used. Total return consists of income return (dividends in the case of stocks, interest in the case of bonds) and its reinvestment, as well as capital appreciation. Thus, assume a dollar invested at the beginning of year t grows to x dollars by the end of year t. In that instance, the rate of total return for year t is 100(x–1) percent.
Annual returns data for some of the underlying funds were not available for the entire 1926–2008 period. We approximate the annual returns (gross of administrative expenses) for each fund as follows:
C Fund. The C Fund holds a broadly diversified portfolio of stocks of large and medium-size U.S. firms. The objective of the fund is to match the total return performance of the S&P 500 Index.
For rates of return on C Fund assets for 1926–2008, we use annual total returns (in percent) on large company stocks from Table 2-5 of Ibbotson SBBI 2009 Classic Yearbook published by Morningstar, Incorporated (Ibbotson Associates 2009). For 1990–2004, the average of these rates of return (about 12.4 percent) was about 30 basis points (about 3 percent) higher than the average rate of return net of administrative costs on TSP's C Fund. Total returns are given in nominal (not real) terms. The Ibbotson large company stock return index is based on the S&P Composite Index. Currently, the S&P Composite Index includes 500 of the largest stocks (in terms of stock market capitalization value) in the United States; prior to March 1957 it consisted of 90 of the largest stocks. The total return index reflects the effect of reinvesting dividends in the S&P Composite Index basket of stocks.
I Fund. The I Fund holds a diversified portfolio of stocks of companies in developed countries outside the U.S. and Canada. The objective of the I Fund is to match the total return performance of the Morgan Stanley Capital International EAFE (Europe, Australasia, Far East) Index, a broad international market index made up of stocks of large companies in 21 developed countries.
For rates of return on I Fund assets for 1970–2008, the study uses annual total returns on the EAFE index from Table 13-6 of the 2009 Ibbotson Yearbook; this rate of return series begins with 1970. For 2002–2004, the average of the EAFE rates of return was about 75 basis points (about 5 percent) higher than the average rate of return net of administrative costs on the TSP I Fund. For 1926–1969, annual total returns on a proxy EAFE index constructed by Global Financial Data (GFD) are used. The countries included in the GFD index are mostly the same as those included in the EAFE index; however, the weighting system is quite different.
S Fund. The S Fund holds a diversified portfolio of stocks of small- and medium-size U.S. companies. The objective of the S Fund is to match the total return performance of the Dow Jones Wilshire 4500 Completion Index (DJW 4500), a broad market index made up of stocks of U.S. companies not included in the S&P 500 Index.
For rates of return on S Fund assets for 1984–2008, we use annual total returns on the DJW 4500 Index; this rate of return series begins with 1984. The data come from Ibbotson Associates. For 2002–2004 the average of the DJW 4500 rates of return was about 60 basis points (about 4 percent) higher than the average rate of return net of administrative costs on the TSP S Fund.
For S Fund rates of return for 1926–1983, annual total returns on mid-cap stocks were used after statistical analysis showed that for 1984–2004, mid-cap rates of return were good predictors of the DJW 4500 total rates of return. In fact, the mid-cap rates of return were at least as good as predictors as any of the individual decile rates of return, and substantially better than low-cap rates of return.33
G Fund. The TSP's G Fund is invested exclusively in short-term U.S. government securities (with maturities ranging from 1 day to 4 days over holiday weekends), but the securities earn a long-term interest rate. Because the long-term rate usually exceeds short-term rates, the TSP G Fund in effect receives an interest rate subsidy.
To generate an unsubsidized rate that may be more realistic for RSAs designed for the general public as contrasted with a fringe benefit for federal workers, we use annual total returns (in percent) on 1-month U.S. Treasury bills from Table 2-5 in the 2009 Ibbotson Yearbook.
Despite the use of an unsubsidized interest rate for the G Fund, all simulations use current TSP portfolio allocation percentages for the L Funds. Those allocations imply that a somewhat larger share of our account balances is in the unsubsidized G Fund than probably would have been chosen by TSP administrators.
F Fund. The F Fund holds a diversified portfolio of bonds from the various sectors of the U.S. bond market. The objective of the F Fund is to match the total return performance of the Barclays Capital (formerly Lehman Brothers) U.S. Aggregate (LBA) index, a broad index representing the U.S. bond market. The LBA index consists of high quality fixed-income securities with maturities of more than one year. The index includes U.S. government bonds, mortgage-backed securities (Fannie Mae and others), corporate bonds, and foreign government bonds denominated in U.S. dollars.
For rates of return on the F Fund for 1976–2008, we use annual total returns data for the LBA index as reported by Ibbotson Associates; this rate of return series begins with 1976. For rates of return on the F Fund for 1926–1975, we use annual total returns on intermediate-term government bonds from Table 2-5 in the 2009 Ibbotson Yearbook. Statistical analyses we conducted show that for 1976–2004, intermediate-term government bond rates of return are good predictors of the LBA rates of return and are clearly superior to alternatives evaluated.
Other life-cycle and comparison plans
Stocks. The rates of return used by Shiller (2005) for his equities are based on S&P data on stock prices and dividends. To simulate our other stock-holding plans, we use the same Ibbotson series (based on the S&P 500 Index) that we use to simulate C Fund returns. The Ibbotson series is better documented and more widely used than the Shiller alternative, and using the same series improves comparability between results for the L plan and those of the other stock-holding plans (conservative, baseline, aggressive, 50-50, all-stocks, and no-lose).
Bonds (long term). The rates of return used by Shiller for the bond portion (50 percent) of his bond-money market fund are those on long-term U.S. government bonds. For the bond portion of our bond-money market fund we use rates of return on long-term government bonds from Table 2-5 of the 2009 Ibbotson Yearbook. This Ibbotson series is better documented and more widely used than the Shiller series.
Money market. The rates of return used by Shiller for years through 2004 for the other 50 percent of his bond-money market fund are those on 4–6 month commercial paper until 1997 and then on 6-month certificates of deposit. His rates of return for years after 1936 are based on data from the Federal Reserve. His annual rates of return are total returns to investing for 6 months in January at the January money market rate and for another 6 months in July at the July money market rate. Using Shiller's method we extend the money market rate of return series through 2008. For the money market portion of our bond-money market fund we use the Shiller rates of return for 1926–2004 and our Shiller-method estimates for 2005–2008.
Bond-money market fund. For the conservative, baseline, aggressive, all-bonds, and 50-50 plans, we use the rates of return specified above for bonds (long-term) and money market investments.
Treasury Inflation-Protected Securities (TIPS). The annual real rate of return for TIPS is assumed to be a constant 2.2 percent in all simulations of the no-lose investment strategy. Feldstein (2005) and Poterba and others (2006) assume that the TIPS real rate of return is a constant 2.0 percent, but those studies as well as the U.S. Treasury determine TIPS nominal returns using the Consumer Price Index for all Urban Consumers (CPI-U) to measure inflation. All annual real rates of return in our research are determined by published nominal values and a PCE-based measure of inflation. For 1926–2008, the average annual rate of increase of the CPI-U exceeds that of the PCE price index by about 0.2 percentage points (3.0 versus 2.8 percent); thus our lower measured inflation rate generates a real rate of return higher by 0.2 percentage points. Because the difference between annual CPI-U inflation rates and annual PCE inflation rates is not constant over time, it follows that our constant rate assumption does not produce a constant TIPS real rate of return as calculated using the CPI-U.
Inflation
For 1930–2008, real asset returns are derived by adjusting nominal values for inflation as measured by the implicit price deflator for PCE. For 1926–1929, inflation rates are computed using the Consumer Price Index. Monthly PCE data are available from the Bureau of Economic Analysis (BEA) starting in 1959. Quarterly data are available from 1947, and annual values from 1929. For 1960–2009, the price level (Pt ) at the start of year t is calculated as the arithmetic mean of the December PCE value for year t–1 and the January value for year t. For 1948–1959, an analogous calculation is made using the fourth-quarter value for year t–1 and the first-quarter value for year t. For 1930–1947, the calculation for year t is the mean of the annual PCE values for years t–1 and t. The PCE data were the values available from the BEA Web site on April 1, 2009. The decimal value of the inflation rate for year t is computed as (Pt+1/Pt)–1.
Notes
1 The view that the equity share of the total value of the portfolio should decline with age was challenged in a celebrated article by Samuelson (1969), who argued for a constant share over the life cycle determined solely by the investor's risk tolerance. More elaborate models that incorporate earnings risk and labor supply decisions can reestablish a basis for decreasing the share of risky assets as one grows older (for example, Bodie, Merton, and Samuelson 1992).
2 RSAs include defined-contribution plans, Keogh accounts, and traditional and Roth Individual Retirement Accounts. Defined-contribution plans include 401(k) and 403(b) plans, employee stock ownership plans, and profit-sharing plans.
3 Employers are permitted to enroll new workers automatically unless the worker actively opts out. Qualified default investment alternatives direct contributions into diversified portfolios that contain a mix of equities and fixed-income assets. Contributions to the plan can be automatically invested in a life-cycle fund if the worker fails to choose an alternative option. Recent research shows the strong effects that pension plan default options have on both worker participation and portfolio investment choices (Beshears and others 2010). TIAA-CREF (2008) projects that life-cycle fund assets will reach $325 billion by 2010.
4 The TSP is the equivalent of a 401(k) plan for federal workers.
5 The TSP offers five life-cycle funds, four of which are dated (L 2010, L 2020, L 2030, and L 2040), as well as the L Income Fund. The undated L Income Fund offers investors a static conservative portfolio allocation, rebalanced daily to maintain the target investment mix. Prospective investors are advised to choose the dated fund whose expiration date falls closest to the anticipated year of retirement. Except for the initial start-up phase when the duration of all dated L Funds (but not the L Income Fund) is abbreviated, the basic design is that each dated fund's risk exposure declines over 40 years, with the portfolio composition gradually evolving from the most aggressive to the most conservative allocation. Every 10 years (in calendar years ending in zero) one fund is retired and a new one begins. For example, in 2010, the L Fund 2010 will end (participant portfolios are transferred into the conservative Income Fund), and the L Fund 2050 will commence. Thus, there are always four evolving L Funds plus the static Income Fund. With a single L Fund maturing once each decade, even potential investors who like the dynamics of the L Fund portfolio reallocation strategy may find that no fund fits their own retirement plans as closely as they would prefer.
6 At present, the L 2040 Fund has the longest duration (35 years) with specified allocations for each year. Allocations for the first 5 years of a 40-year L Fund are the authors' guesses.
7 Allocation targets for the simulated dated L Funds are updated on the first day of each year. The allocations shown in the table reflect the scheduled updating that occurs on the first day of the following year. In reality, the TSP L Fund targets are reset quarterly and accounts are rebalanced daily.
8 In reality, TSP's G Fund invests in short-term U.S. government securities, but those securities earn long-term interest rates. Because long-run interest rates usually exceed short-run rates, the G Fund effectively receives an interest rate subsidy, a subsidy that is probably not relevant for most RSAs. The simulations described in this article use unsubsidized G Fund returns but retain L Fund portfolio allocation rules. That inconsistency causes the G Fund portfolio share to exceed target allocations that would have been chosen had L Fund designers assumed unsubsidized short-run interest rates.
9 To be more precise, the matched SIPP data contain annual taxable earnings amounts only for years 1951 and later. The administrative earnings data provide a single total nominal taxable earnings figure for the period 1937–1950. For sample members born prior to 1929, part of their age 22–61 earnings fall within the 1937–1950 period. In those cases, 1937–1950 total earnings were allocated to specific years based on age, Social Security credits earned prior to 1951, and the growth rate in average earnings in the economy during that period.
10 Fully-insured status requires the accumulation of a specified number of Social Security credits, the rules for which have changed over time. For example, current law indicates that the 1915 birth cohort needs 26 credits, the 1916 cohort needs 27 credits, and so on, up to the 1929 cohort and all ensuing cohorts, who need 40 credits. Credits are now awarded for earning a specified amount that is adjusted annually for average earnings growth in the economy. The 2009 figure is $1,090 per credit. A maximum of 4 credits can be earned each year.
11 The AWI is the nationwide average earnings each year in the economy and includes earnings amounts that exceed the annual maximum taxable earnings.
12 During the 1950s, about 40 percent of male workers reached the taxable maximum each year; during 1990–2003, that figure was 9 percent. The comparable figures for women are much lower: 6 percent during the 1950s and 2 percent more recently.
13 Prior to 1978, the administrative earnings data used in this study do not record earnings above the annual taxable maximum paid by an employer. Since 1978, Social Security Administration (SSA) records give total earnings in covered employment. Thus, for 1978–1989 it is straightforward to estimate taxable earnings subject to the higher alternative taxable maximums. For years prior to 1978 when only taxable earnings were recorded, we first estimate total covered earnings by using SSA data on quarters of coverage and Current Population Survey earnings data, and then apply the higher taxable maximum. The quarters of coverage data for 1951–1977 allow us to determine the quarter of the calendar year during which the taxable maximum was attained. With an assumption of steady earnings throughout the year, upper and lower bounds can be established for total earnings in covered employment if the maximum is attained during quarters 2–4. Each person is assigned the mean for that earnings interval as derived from the Current Population Survey annual earnings data. For workers who reach the taxable maximum during the first quarter, only a lower bound can be determined, in which case total annual earnings are imputed based on annual earnings above the lower bound as reported in the 1965, 1970, and 1975 Current Population Surveys.
14 Average annual real earnings are the arithmetic mean of a person's annual earnings during ages 22–61, with all earnings amounts converted to 2004 dollars using the implicit price deflator for Personal Consumption Expenditures (PCE).
15 Because spending patterns evolve over time, the PCE price index is a better measure of change in the cost of living than the Consumer Price Index for Urban Consumers (CPI-U). A full explanation of the inflation calculation is provided in the Appendix.
16 TIPS real interest rates measured monthly for 10-year and 30-year bonds averaged 2.11 percent and 2.28 percent, respectively, for the period June 2002 through September 2007.
17 Recent research by Feldstein (2005) and Poterba and others (2006) assumes a TIPS real rate of return of 2.0 percent. The 2.2 percent assumption is consistent with their figure in light of the PCE-based inflation calculation used in this article to derive real rates of asset returns from published nominal values. See Appendix for further information.
18 As defined by Mehra and Prescott (2003), the equity premium can be thought of as the return earned by (risky) stocks in excess of the rate earned by a relatively riskless Treasury bond.
19 Average contribution rates for private sector RSAs are estimated to be 8.3 percent to 9.9 percent (Poterba and others 2007).
20 This assumption is based on the fact that 60 percent of fully insured workers begin receiving Social Security benefits at age 62. The imposition of a common retirement age for all workers means that any variations in preretirement RSA accumulations and IRRs are not attributable to differences in contribution periods associated with varying retirement ages.
21 Account accumulations assume that half of the year's contribution is made at the start of the year and is subject to that year's investment returns. The remaining half is deposited at the end of the year, after which the year's administrative expenses on the account are subtracted.
22 The positive trend in mean real earnings during ages 22–61 for the sample's 28 birth cohorts (Table 2) reflects the growth in average annual earnings in the economy that occurred during 1937–2003; the average (geometric mean) growth rate was 1.5 percent. Because annual earnings determine RSA contribution amounts, later birth cohorts have larger final account accumulations, on average, simply because they invest larger sums of money. In the stochastic simulations, the mean IRR for each allocation strategy is nearly identical for every cohort. To evaluate the effectiveness of alternative allocation strategies, this article focuses on IRRs rather than account accumulations.
23 The dark midline within the shaded rectangles represents the distribution's median value. The left and right edges of the shaded rectangle respectively represent the 25th and 75th percentile values; vertical lines at the end of the whiskers (known as lower and upper adjacent values) are 1.5 times the interquartile range beyond the 25th and 75th percentile values. Outlier values—data points lying outside the lower and upper adjacent values—are plotted individually in the figures.
24 The maximum and minimum simulated IRR values reported in Tables 4 and 6 and Chart 1 depend on the numbers of simulations conducted (1,000). Because larger numbers of simulations would generate more extreme values, the reader should note that the maximum and minimum values are simply the reported results of a specific experiment.
25 The conservative plan has the lowest IRR of the four life-cycle plans except for the lowest 3 percent of the distributions of returns.
26 The corresponding percentage reductions in final accumulations are somewhat higher: 38–39 percent (baseline and conservative plans), 36 percent (L plan), 30 percent (aggressive plan), and 18 percent (50-50 plan).
27 Other recent studies of life-cycle investment strategies (for example, Soto and others (2008) and Gomes, Kotlikoff, and Viceira (2008)) focus on an investor's choice of the optimal (utility-maximizing) allocation of assets over the lifespan. The solution depends on the individual's age, risk aversion, human capital, labor supply, earnings uncertainty, and the distributions of returns for financial assets.
28 For details about the construction of the scaled-worker earnings histories, see Clingman and Nichols (2008).
29 Shiller's first simulation uses returns for 1871–1914, the second uses 1872–1915 returns, and so on, eventually ending with the 91st simulation using 1961–2004 returns. Thus, returns for 1871 and 2004 are used in only one simulation, returns for 1872 and 2003 are used in two simulations, and so on, with only the middle years (1914–1961) used in 44 simulations.
30 Their utility analysis focuses on total wealth (both retirement account and nonretirement account) at retirement, taking into account how the risk aversion of each household affects their valuation of alternative retirement account investment strategies. Annual account contributions are assumed to equal 9 percent of total household earnings in Social Security–covered employment when husbands are aged 28–63.
31 The authors also simulate the performance of two "optimized portfolio strategies" in which the time path of the portfolio composition depends on the assumed level of risk aversion. Those results are difficult to compare with our own and are not discussed here.
32 Experiments with stochastic simulations on hypothetical workers with various patterns of zero-earnings years (multiyear sequences of varying lengths at the beginning or end of the 22–61 age interval) indicate that more zeros at the beginning substantially reduce the mean IRRs in life-cycle plans and increase their standard deviation. For example, in the baseline plan, a 25-year worker (no earnings during ages 22–36) has a mean IRR that is 12 percent lower than that of a 40-year worker while the standard deviation is 6 percent larger. More zeros at the end of earnings histories result in slightly higher mean IRRs for the life-cycle plans but have little effect on dispersion. For instance, in the baseline plan, the mean IRR was 2 percent higher for the 25-year worker than for the 40-year worker. The number and location of zero-earnings years has little effect on mean IRRs for the all-stocks, all-bonds, and 50-50 plans, but substantially increases the standard deviations of the IRR distributions when positioned at the beginning of the earnings history. The influence of zero-earnings years on the no-lose plan's mean IRR is similar to that for the life-cycle plans.
33 The Center for Research in Security Prices (CRSP) at the University of Chicago computes total annual rates of return for a number of stock-size categories for years since 1925. All companies on the New York Stock Exchange (NYSE) are ranked by the combined market capitalization of all their eligible equity securities. The companies are then split into 10 equally populated groups or deciles. Eligible companies traded on the American Stock Exchange and the NASDAQ National Market are then assigned to the appropriate deciles according to their capitalization in relation to the NYSE breakpoints. The number of companies per decile increases as the NYSE breakpoint decreases. In addition to its 10 decile rate of return series, CRSP also has rate of return series for mid-cap stocks (deciles 3–5 combined), low-cap stocks (deciles 6–8), and micro-cap stocks (deciles 9–10); these series are given in Tables 7-2 and 7-4 of the 2009 Ibbotson Yearbook.
The coverage of the DJW 4500 index is roughly comparable to that of CRSP's deciles 4–10. The average market value for CRSP decile 4–10 stocks is similar to that for CRSP decile 8 stocks and a bit smaller than that for CRSP low-cap stocks and much smaller than that for CRSP mid-cap stocks (Table 7-5 of 2009 Ibbotson Yearbook). For a possible rate of return series for S Fund assets for 1926–1983 we statistically examined CRSP rate of return series for low-cap stocks, mid-cap stocks, and for each of decile 2-8 stocks.
References
Beshears, John, James J. Choi, David Laibson, Brigitte C. Madrian, and Brian Weller. 2010. Public policy and saving for retirement: The "autosave" features of the Pension Protection Act of 2006. In Better living through economics: How economic research improves our lives, ed. John J. Siegfried. Cambridge, MA: Harvard University Press.
[Board of Trustees] Board of Trustees of the Federal Old-Age and Survivors Insurance and Disability Insurance Trust Funds. 2009. The 2009 Annual Report of the Board of Trustees of the Federal Old-Age and Survivors Insurance and Disability Insurance Trust Funds. Washington, DC: Government Printing Office. Available at http://www.socialsecurity.gov/OACT/TR/2009/tr09.pdf.
Bodie, Zvi, Robert C. Merton, and William Samuelson. 1992. Labor supply flexibility and portfolio choice in a life-cycle model. Journal of Economic Dynamics and Control 16(3–4): 427–449.
Bodie, Zvi, and Jonathan Treussard. 2007. Making investment choices as simple as possible, but not simpler. Financial Analysts Journal 63(3): 42–47.
Brady, Peter J. 2009. What does the stock market crash mean for the ability of 401(k) plans to provide retirement income? National Tax Journal 62(3): 455–476.
Clingman, Michael, and Orlo Nichols. 2008. Scaled factors for hypothetical earnings examples under the 2008 Trustees Report assumptions. Actuarial Note Number 2008.3. Baltimore, MD: Social Security Administration, Office of the Chief Actuary. Available at http://www.socialsecurity.gov/OACT/NOTES/ran3/index.html.
Copeland, Craig. 2009. Use of target-date funds in 401(k) plans, 2007. EBRI Issue Brief No. 327. Washington, DC: Employee Benefit Research Institute.
Department of the Treasury. 2009. Daily Treasury real yield curve rates. Available at http://www.ustreas.gov/offices/domestic-finance/debt-management/interest-rate/real_yield.shtml (accessed August 15).
Feldstein, Martin. 2005. Reducing the risk of investment-based Social Security reform. NBER Working Paper No. 11084. Cambridge, MA: National Bureau of Economic Research. Available at http://www.nber.org/papers/w11084.
Geanakoplos, John, and Stephen P. Zeldes. 2009. Market valuation of accrued Social Security benefits. Cowles Foundation Discussion Paper No. 1711. New Haven, CT: Yale University.
Gomes, Francisco J., Laurence J. Kotlikoff, and Luis M. Viceira. 2008. Optimal life-cycle investing with flexible labor supply: A welfare analysis of life-cycle funds. American Economic Review: Papers & Proceedings 98(2): 297–303.
Ibbotson Associates. 2009. Ibbotson SBBI 2009 classic yearbook: Market results for stocks, bonds, bills, and inflation 1926–2008. Chicago, IL: Morningstar, Inc.
Mehra, Rajnish, and Edward C. Prescott. 2003. The equity premium in retrospect. NBER Working Paper No. 9525. Cambridge, MA: National Bureau of Economic Research. Available at http://www.nber.org/papers/w9525.
[OMB] Office of Management and Budget. 2009. A new era of responsibility: Renewing America's promise. Washington, DC: Government Printing Office. Available at http://www.gpoaccess.gov/usbudget/fy10/pdf/fy10-newera.pdf.
Poterba, James, Joshua Rauh, Steven Venti, and David Wise. 2006. Reducing Social Security PRA risk at the individual level: Lifecycle funds and no-loss strategies. Paper presented at the 8th Annual Joint Conference of the Retirement Research Consortium, Washington, DC.
———. 2007. Defined contribution plans, defined benefit plans, and the accumulation of retirement wealth. Journal of Public Economics 91(10): 2062–2086.
President's Commission to Strengthen Social Security. 2001. Strengthening Social Security and creating personal wealth for all Americans. Available at http://govinfo.library.unt.edu/csss/reports/Final_report.pdf.
Samuelson, Paul A. 1969. Lifetime portfolio selection by dynamic stochastic programming. The Review of Economics and Statistics 51(3): 239–246.
Shiller, Robert J. 2005. The life-cycle personal accounts proposal for Social Security: An evaluation. NBER Working Paper No. 11300. Cambridge, MA: National Bureau of Economic Research. Available at http://www.nber.org/papers/w11300.
Soto, Mauricio, Robert K. Triest, Alex Golub-Sass, and Francesca Golub-Sass. 2008. An assessment of life-cycle funds. CRR Working Paper No. 2008-10. Chestnut Hill, MA: Center for Retirement Research at Boston College.
[TIAA-CREF] Teachers Insurance and Annuity Association—College Retirement Equities Fund. 2008. Life-cycle funds: Asset management made easy. Investor information sheet. Available at http://www.tiaa-cref.org/administrators/pdf/admin_library/C40606.pdf.
Viceira, Luis M. 2009. Life-cycle funds. In Overcoming the saving slump: How to increase the effectiveness of financial education and saving programs, ed. Annamaria Lusardi. Chicago, IL: University of Chicago Press. Available at http://www.people.hbs.edu/lviceira/Life-Cycle%20Funds_Lusardi_011008.pdf.