How Have People Responded to Changes in the Retirement Earnings Test in 2000?
Social Security Bulletin, Vol. 67, No. 1, 2007
This article explores how individuals affected by the removal of the earnings test have changed their participation in the workforce and the amount that they earn. It also looks at changes in benefit claiming among those who have reached the full retirement age. Results are based on longitudinal data from the Social Security Administration that cover the 4 years before and after the change.
The authors are with the Division of Economic Research, Office of Research, Evaluation, and Statistics, Office of Policy, Social Security Administration.
Acknowledgments: The authors are grateful to Ed DeMarco, Linda Maxfield, and Susan Grad for their support. We received helpful comments from Lee Cohen, Mark Duggan, Leora Friedberg, Steve Goss, Jonathan Gruber, Mark Sarney, Tim Kelly, Bert Kestenbaum, Wojciech Kopczuk, Emmanuel Saez, David Stapleton, David Weaver, participants at the NBER Summer Institute 2005 and Tax Economists Forum, and other Office of Policy staff members. The authors thank Bill Kearns, Henry Ezell, Pat Cole, and Nancy O'Hara for their help.
The findings and conclusions presented in the Bulletin are those of the authors and do not necessarily represent the views of the Social Security Administration.
Summary
This article describes responses to removing the retirement earnings test in 2000 for persons at the full retirement age or older. We examine annual earnings and retirement benefit claims from Social Security administrative data that cover the 4 years before and after the change. Three findings emerge from the study.
First, the effect on earnings of removing the earnings test is uneven across people with different earnings levels. We find little effect on earnings at lower levels, but the effect on earnings in the mid to upper levels (50th to 80th percentiles) is large and significant. Such a finding indicates that the removal most affects people with earnings levels above the earnings test threshold. The largest increases in earnings are found at the 70th percentile for persons who have attained ages 65–69 and at the 60th percentile for those turning 65.
Second, there is no clear evidence of the effect of the test's removal on the overall rate of labor force participation. A small rise in work participation among individuals aged 65–69 may be at least partially attributable to the trend already under way. Increases in work participation that do occur are mostly attributable to retaining older workers rather than inducing older workers back into the workforce. The effect appears to increase over time, suggesting that the removal has long-lasting effects on work participation.
Third, the removal of the earnings test accelerated applications for benefits by 2 to 5 percentage points among individuals aged 65–69 and by 3 to 7 percentage points among those reaching age 65.
Introduction
The retirement earnings test, which has been part of the Social Security Old-Age and Survivors Insurance (OASI) program since its inception in 1935, has been gradually modified by exempting certain age groups, increasing allowable earnings, and decreasing withholding rates. A rationale for modifications is to encourage older people to work so that their earnings can supplement their Social Security benefits as people live longer and healthier lives. The most recent major modification occurred in April 2000, when Congress enacted the Senior Citizens Freedom to Work Act of 2000, which removed the earnings test for individuals at the full retirement age (FRA), age 65 or older.1 The removal of the test in 2000 is one of the most substantial changes in recent years because it affects both the most recent cohorts of persons who have reached the FRA and a wider range of ages than had prior modifications.
Although the earnings test compensates individuals for postponing benefit entitlement by increasing their future benefit streams through the delayed retirement credit and automatic benefit recomputation, many people do not view those adjustments as actuarially fair. That is, many people view the earnings test as a tax on earnings above the test threshold, causing both a reduction in work effort (for example, hours of work, earnings, and work participation) of old-age beneficiaries and a delay in applications for Social Security retirement (old-age) benefits.
Three recent studies of how the earnings test affects work and earnings in the United States found mixed effects on the labor supply of older workers. Although Friedberg's (2000) results indicated a small but significant effect of the earnings test on the labor supply of older workers, Gruber and Orszag (2003) indicated that the earnings test had no robust influence on labor supply and appeared to accelerate benefit receipt among eligible individuals. Results reported in Loughran and Haider (2005) indicated that the earnings test had a substantial impact on hours worked and benefits claimed for men.
This study focuses on the most significant single change in the history of the U.S. earnings test. It provides comprehensive empirical evidence on the effects of removing the earnings test for persons aged 65–69 by using a large Social Security Administration (SSA) administrative data set that covers the period from 4 years before to 4 years following the removal (1996–2003).2 By including 4 years of data after the removal, we are able to investigate reactions not only immediately following the removal but also for several years after. Examining responses by older workers over time is especially important because some of them face substantial constraints on reentering the labor force, such as from deteriorating health and outdated skills. Further, our data allow us to examine the uneven impact of the earnings test removal across the distribution of earnings. Individuals with lower levels of earnings may respond differently to the test removal than people with earnings near or above the earnings test threshold.
This article is based on Song and Manchester (2006). For more details about the technical aspects of the analysis, please refer to that paper.
Earnings Test Rules
The earnings test that applies to persons from ages FRA to 69 was removed in 2000, but old-age beneficiaries still remain subject to an earnings test until they reach the FRA. Social Security benefits of persons aged 62–FRA* (that is, the FRA minus 1 month) at year-end are reduced by $1 for every $2 earned beyond the threshold, which was $11,520 in 2003. Those who reach the FRA during the year are subject to a more moderate test; benefits are reduced $1 for every $3 earned beyond the threshold, which was $30,720 in 2003.3 Thus, the removal of the earnings test in 2000 not only eliminated the test for those who had attained ages 65–69 (more precisely, FRA to 69), but it also considerably relaxed the test for those turning 65 (FRA).4
The retirement earnings test operates in a relatively simple manner. Social Security benefits are reduced if earnings exceed the threshold amounts, but the reduction in benefits is at least partially offset in the future through the delayed retirement credit and benefit recomputation.5 Thus, the earnings test has both "tax" and "transfer" features.
The tax feature of the earnings test includes both threshold amounts and withholding rates. The threshold amount varies by the year in which the test applies and by the ages of the beneficiaries (Table 1). Before the removal of the earnings test in 2000, the threshold for persons aged 65–69 as of 1999 was $15,500; for those aged 62–64 it was $9,600. The benefit withholding rate was $1 for each $3 of earnings above the earnings test threshold for individuals aged 65–69 and $1 for each $2 for individuals aged 62–64.
| Age | Earnings test threshold (dollars) | Withholding rate | |||
|---|---|---|---|---|---|
| 1996 | 1997 | 1998 | 1999 | ||
| 62–64 | 8,280 | 8,640 | 9,120 | 9,600 | $1 for each $2 of earnings above the threshold |
| 65–69 | 12,500 | 13,500 | 14,500 | 15,500 | $1 for each $3 of earnings above the threshold |
| SOURCE: Social Security Administration, Annual Statistical Supplement to the Social Security Bulletin, 2003 (2004). | |||||
The transfer feature of the earnings test, often overlooked because of the focus on the tax feature, compensates for the withholding of benefits under the earnings test by increasing the primary beneficiary's future benefit stream. Two aspects of the Social Security rules compensate individuals who are subject to the earnings test: the delayed retirement credit and benefit recomputation. Future benefits for individuals who have not received benefits because of the earnings test (or for any other reason) are increased for each month in which no benefits are paid. This increase is 1/4 of 1 percent for each month, plus 1/24 of 1 percent for each even numbered year, from 1990 through 2008, in which workers are at the FRA or older. Thus, for those who turned 65 in 2000–2001, the delayed retirement credit is 1/2 of 1 percent for each incremental month, or 6 percent per year.6 A benefit recomputation rule may apply to persons who become entitled to benefits but who subsequently have substantial covered earnings. The recomputation can increase benefits when earnings in the additional years are higher than the lowest earnings used in the current computation.7 In addition, reductions in benefits stemming from claiming benefits before the FRA can be undone by the recomputation if benefits have been withheld completely because of sufficiently high earnings above the threshold.
When earnings exceed the test's threshold, the total family benefit is reduced accordingly, including all benefits (other than Disability Insurance) payable to anyone in the family entitled to benefits on the primary earner's earnings record. For purposes of the earnings test, an individual's earnings for the entire taxable year are counted, even if the individual has not been entitled to benefits for the entire year.8 In addition, self-employment earnings are counted for the year in which they are received, regardless of when they are earned. Countable income for the earnings test includes wages from covered employment, cash payments for agricultural or domestic work, cash tips, deferred compensation, and pay for work not covered by Social Security if the work is done in the United States.9
Economic theory on the effects of the earnings test on labor supply is fairly straightforward and can be found in numerous studies.10 A general consensus from those studies is that a delayed retirement credit that is actuarially fair would offset the effects of the earnings test. Removing the earnings test would not affect benefit claim choices, earnings, or labor supply hours if current benefit withholdings were exactly compensated by future benefit increases and individuals were forward-looking. When the transfer aspect of the earnings test is ignored (or unfair) or when the discount rate is high, kinks appear in a static budget constraint under the earnings test. In that case, eliminating the test yields results equivalent to reducing marginal tax rates, but the change in marginal tax rates depends on individuals' earnings levels and benefit entitlement status. The marginal tax rate is zero for nonbeneficiaries or those who earn below the test threshold and 33 percent for beneficiaries who earn above the threshold until all benefits are withheld. Removing the earnings test yields negative income effects above the upper threshold where all benefits are withheld, both negative income effects and positive substitution effects between the upper and lower thresholds, and no effects below the lower threshold. In other words, effects of eliminating the earnings test on labor hours and earnings will not be the same for all individuals. The magnitude and direction of possible effects depend on the ratio of the rates of return at which individuals are willing to lend (that is, not claim benefits, or claim benefits and work above the threshold) to the rates that are available to them through Social Security. The latter is affected by the benefit withholding rate, test threshold, delayed retirement credit, cost-of-living adjustment, and the time preference and mortality of the individual.
Data Sources
This study uses data on primary workers from an extract of the Social Security Administration's 1 percent (active) sample, commonly known as the Continuous Work History Sample active file.11 The 1 percent samples are selected on the basis of certain serial digits of the Social Security number (SSN) and are generally considered to be random samples. To be selected for this study, a person must be fully insured by age 62 and must never have received Social Security Disability Insurance benefits. Once a person is selected, he or she stays in the active sample for life. For selected SSNs, information on annual earnings (both capped at the taxable maximum and uncapped), OASDI (Old-Age, Survivors, and Disability Insurance) benefit entitlements, and death records, if any, are obtained from several SSA administrative files.
The sources for the Continuous Work History Sample include the Numident, the Master Earnings File, and the Master Beneficiary Record. The Numident is a master file of assigned SSNs that contains birth and death dates, place of birth, race, and sex. The Master Earnings File contains annual Social Security summary earnings from 1937 to the present. It also contains annual detailed earnings, Medicare taxable compensation, and total compensation from 1978 to the present for the U.S. population. The earnings records are taken directly from W-2 forms. A Master Earnings File record is created when the corresponding Numident record is created. The Master Beneficiary Record file contains data related to the administration of the OASDI program, such as application and entitlement dates, benefit amounts, payment status, type of benefits, and demographic information. A beneficiary record is established when an individual applies for benefits and the application is processed.12
The 1 percent extract of SSA administrative records provides several advantages over other data used for studying the effects of the earnings test. First, the 1 percent extract contains accurate annual earnings records that are not plagued by the self-reporting problems that are common in survey-based records. We use Medicare taxable earnings because the earnings test counts all covered wage and self-employment income, including deferred compensation. The same definition of income has been taxable under Medicare since 1994. Second, SSA data contain the exact date of entitlement for old-age benefits. For the earnings test, individuals' earnings for an entire taxable year are counted even if the individuals were not entitled to benefits for the entire year.13 Hence, whether or not an individual becomes entitled to retirement benefits during a given year is critical information. Third, the 1 percent sample contains a large number of observations and represents the general population. In our sample of fully insured individuals who are not receiving Social Security Disability Insurance benefits, approximately 88 percent are white and 54 percent are male. Sample sizes vary by calendar years, from 168,486 in 1996 to 178,217 in 2003.
Methodology
The main features of the change in the earnings test in 2000 dictate the age groups of interest for our study. Those features are (1) the complete elimination of the earnings test for individuals who have attained the FRA as of December 31 of the year before the relevant year and (2) a modified earnings test with significantly increased test threshold amounts for those who reach the FRA during the relevant year.14 Hence we consider two separate groups who are directly affected by the change in the earnings test: those who turn 65 during the year and those who have attained ages 65–69 by January 1 of a particular year. As comparison groups that are not directly affected by the change in the earnings test, we consider those both younger and older than the affected groups: individuals turning 62–64 and those who have attained ages 70–72.15 During the study period, those who had attained ages 70–72 faced no earnings test, while those turning 62–64 faced no change in test rules, except that the threshold amounts were gradually increased. As a result, there are two affected groups and two comparison groups in each calendar year from 1996 through 2003:
- Group 1—the younger comparison group, who turn ages 62–64;
- Group 2—the younger affected group, who turn age 65;
- Group 3—the older affected group, who have attained ages 65–69;
- Group 4—the older comparison group, who have attained ages 70–72.
Descriptive Analyses on Work and Retirement Among Workers Aged 62–72
Movements in work participation, benefit entitlement, transitions to work, and earnings of the affected groups relative to the comparison groups give a preliminary view of the effects of the rule changes.16 From 1996 to 1999, earnings test rules for our control and treatment groups remained unchanged except for gradual increases in the test threshold each year. If our comparison groups are suitable, we expect to see parallel movements in outcome variables of the affected and comparison groups during the pre-2000 period.
Effects on Work Participation and Benefit Entitlement
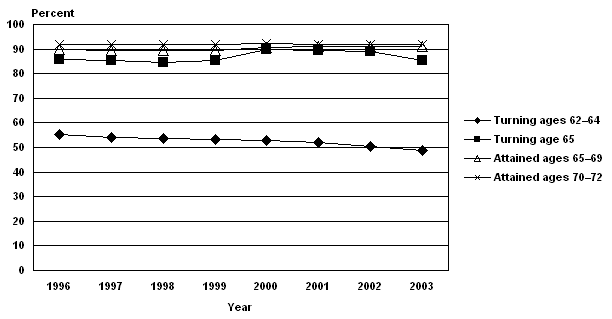
As shown in Chart 1, work participation rates during the preremoval period among those in the age groups 62–64, 65, 65–69, and 70–72 are approximately 52 percent to 55 percent, 40 percent to 44 percent, 26 percent to 29 percent, and 16 percent to 18 percent, respectively. Results show that during the preremoval period, rates of work participation and benefit entitlement as of the end of each year tend to move together. Work participation rates increased slightly over the postremoval period, continuing the trend already in place. Benefit entitlement rates among those aged 64 or younger tended to fall slightly over the study period, but rates for those aged 65 or older tended to increase slightly over time.
Rates of work participation and benefit entitlement, by age group, 1996–2003
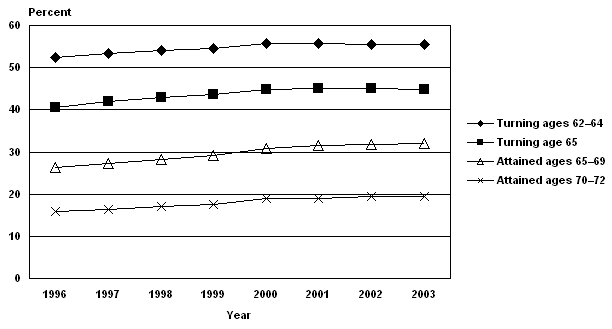
| Year | Turning ages 62–64 | Turning age 65 | Attained ages 65–69 | Attained ages 70–72 |
|---|---|---|---|---|
| Work participation | ||||
| 1996 | 52.33 | 40.52 | 26.30 | 15.79 |
| 1997 | 53.43 | 42.00 | 27.27 | 16.45 |
| 1998 | 53.98 | 42.93 | 28.32 | 17.17 |
| 1999 | 54.66 | 43.52 | 29.22 | 17.60 |
| 2000 | 55.67 | 44.85 | 30.72 | 18.87 |
| 2001 | 55.73 | 45.09 | 31.43 | 18.87 |
| 2002 | 55.39 | 45.13 | 31.85 | 19.48 |
| 2003 | 55.38 | 44.76 | 32.09 | 19.56 |
| Benefit entitlement | ||||
| 1996 | 55.18 | 85.59 | 89.78 | 91.87 |
| 1997 | 54.19 | 85.21 | 89.60 | 91.94 |
| 1998 | 53.74 | 84.67 | 89.35 | 92.02 |
| 1999 | 53.30 | 85.26 | 89.38 | 92.04 |
| 2000 | 52.87 | 89.76 | 90.63 | 92.15 |
| 2001 | 51.93 | 89.27 | 91.00 | 91.81 |
| 2002 | 50.49 | 88.84 | 90.98 | 91.98 |
| 2003 | 48.65 | 85.38 | 91.18 | 91.96 |
Since approximately 85 percent of the younger affected group became entitled by the end of each year in the preremoval period, it is hard to see changes in entitlement rates from Chart 1. We therefore present the percentage of beneficiaries who became entitled in each year in Chart 2. The percentage of beneficiaries who became entitled in 1999 and 2000 increased from 22 percent to 28 percent for the younger affected group (those who were turning 65). Over the same period, the percentage increased from 1.5 percent to 2.7 percent for the older affected group (those who had attained ages 65–69). Following the removal of the earnings test, benefit entitlement rates increased slightly for the two older age groups, but they decreased slightly for the two younger age groups, probably because of the gradual increase in the FRA. As a result of the gradual increase in the FRA for those who were born in 1938 or later, the FRA differs across the 62–64 age group in 2000–2003.17
Beneficiaries becoming entitled during each year, 1996–2003
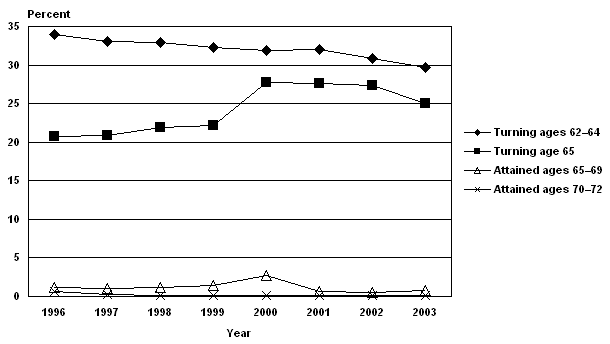
| Year | Turning ages 62–64 | Turning age 65 | Attained ages 65–69 | Attained ages 70–72 |
|---|---|---|---|---|
| 1996 | 33.92 | 20.73 | 1.13 | 0.62 |
| 1997 | 33.06 | 20.88 | 1.09 | 0.23 |
| 1998 | 32.91 | 21.92 | 1.19 | 0.13 |
| 1999 | 32.27 | 22.13 | 1.45 | 0.10 |
| 2000 | 31.84 | 27.69 | 2.66 | 0.12 |
| 2001 | 32.03 | 27.60 | 0.69 | 0.08 |
| 2002 | 30.80 | 27.39 | 0.57 | 0.12 |
| 2003 | 29.66 | 25.04 | 0.83 | 0.13 |
Although the descriptive results show no clear evidence of effects of the earnings test removal on work participation rates, they suggest that benefit entitlement rates for persons turning 65 are somewhat higher after the removal. The magnitude of the increase does not appear to be large, perhaps because most individuals have already become entitled to old-age benefits before they reach age 65.
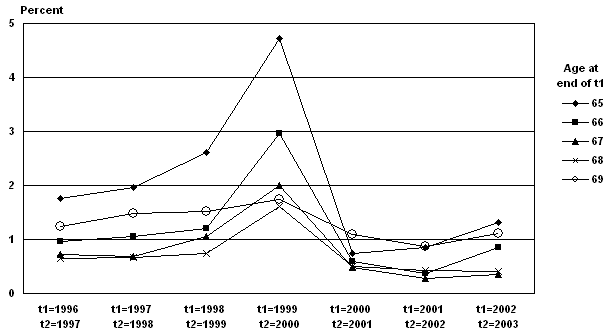
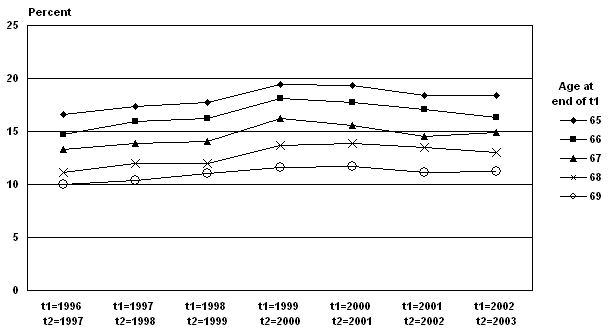
Effects on Work Transitions
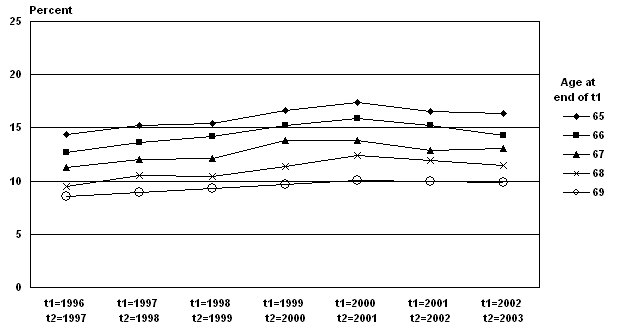
The large sample size and the longitudinal format of our data allow us to follow persons of a particular age from one year to the next. For each age 65 through 69 as of the end of each year 1996–2002 (year t1), Chart 3 presents joint probabilities of transitions from "not working" in year t1 to "working" in the subsequent year (year t2) from 1997 through 2003. The chart also presents age-specific probabilities of transitions from "not entitled" to "entitled." Results show that the probability of transition from "not working" to "working" increased noticeably between t2 = 1999 and t2 = 2000 but then stabilized at a lower level for ages 65–69. The probabilities of transition from "not-entitled" to "entitled" for those aged 65 almost doubled between t2 = 1999 and t2 = 2000 and more than doubled for those aged 66, then stabilized at a lower level after t2 = 2000. The numbers suggest that the removal of the earnings test in 2000 had a clear impact on benefit claims among older workers.
Probability of transition from not working in t1 to working in t2 and from not entitled in t1 to entitled in t2, by age at the end of t1
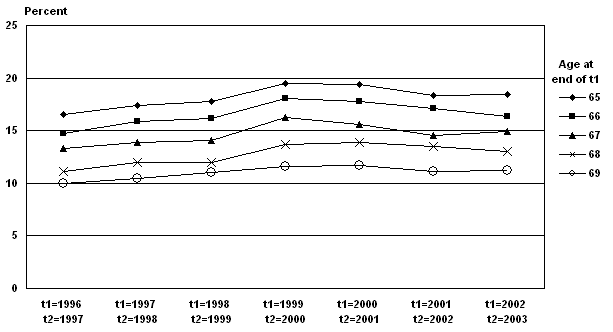
| Age at end of t1 | t1=1996 t2=1997 |
t1=1997 t2=1998 |
t1=1998 t2=1999 |
t1=1999 t2=2000 |
t1=2000 t2=2001 |
t1=2001 t2=2002 |
t1=2002 t2=2003 |
|---|---|---|---|---|---|---|---|
| Not working in t1 to working in t2 | |||||||
| 65 | 16.58 | 17.36 | 17.73 | 19.44 | 19.35 | 18.37 | 18.40 |
| 66 | 14.75 | 15.91 | 16.20 | 18.10 | 17.74 | 17.08 | 16.32 |
| 67 | 13.30 | 13.89 | 14.10 | 16.23 | 15.56 | 14.57 | 14.95 |
| 68 | 11.10 | 12.01 | 11.99 | 13.70 | 13.86 | 13.46 | 13.01 |
| 69 | 9.97 | 10.41 | 11.01 | 11.57 | 11.69 | 11.16 | 11.19 |
| Not entitled in t1 to entitled in t2 | |||||||
| 65 | 1.76 | 1.96 | 2.62 | 4.72 | 0.75 | 0.86 | 1.32 |
| 66 | 0.97 | 1.06 | 1.2 | 2.96 | 0.59 | 0.37 | 0.85 |
| 67 | 0.72 | 0.69 | 1.06 | 2.0 | 0.48 | 0.27 | 0.35 |
| 68 | 0.65 | 0.67 | 0.74 | 1.61 | 0.5 | 0.42 | 0.41 |
| 69 | 1.24 | 1.49 | 1.52 | 1.74 | 1.09 | 0.87 | 1.12 |
Effects on Earnings
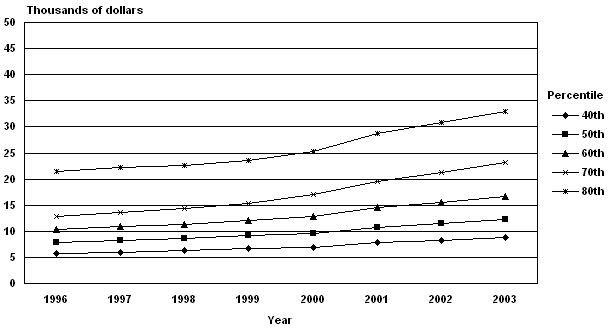
To examine more closely the effects on earnings at different points along the distribution, we look at nominal earnings at the 40th through 80th percentiles for those who work over the study period, by age groups affected by the rule change (Chart 4). Results show gradual increases in the earnings of working individuals over the study period, measured either by the simple mean over the entire sample or at each decile of the earnings distribution. The gradual increases in earnings at the various deciles appear to accelerate slightly in 2000 for both affected groups, which could indicate that earnings of the affected groups are influenced by the earnings test removal.
Nominal earnings of the two age groups affected by the rule change, by earnings percentile, 1996–2003
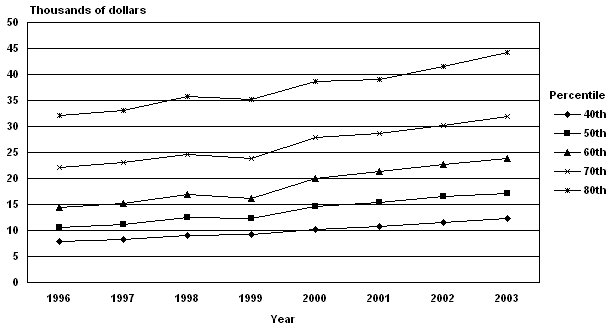
| Percentile | 1996 | 1997 | 1998 | 1999 | 2000 | 2001 | 2002 | 2003 |
|---|---|---|---|---|---|---|---|---|
| Those turning age 65 | ||||||||
| 40th | 7.800 | 8.174 | 9.000 | 9.138 | 10.263 | 10.850 | 11.618 | 12.285 |
| 50th | 10.562 | 11.196 | 12.479 | 12.313 | 14.609 | 15.300 | 16.606 | 17.200 |
| 60th | 14.494 | 15.149 | 16.972 | 16.214 | 19.931 | 21.330 | 22.747 | 23.894 |
| 70th | 22.185 | 23.008 | 24.651 | 23.918 | 27.825 | 28.564 | 30.200 | 31.986 |
| 80th | 32.206 | 33.065 | 35.825 | 35.247 | 38.596 | 39.082 | 41.564 | 44.174 |
| Those who have attained aged 65–69 | ||||||||
| 40th | 5.754 | 5.888 | 6.264 | 6.639 | 6.984 | 7.875 | 8.304 | 8.787 |
| 50th | 7.884 | 8.207 | 8.586 | 9.111 | 9.600 | 10.791 | 11.497 | 12.250 |
| 60th | 10.400 | 10.912 | 11.359 | 11.997 | 12.750 | 14.468 | 15.508 | 16.737 |
| 70th | 12.766 | 13.551 | 14.437 | 15.394 | 17.000 | 19.602 | 21.337 | 23.120 |
| 80th | 21.549 | 22.208 | 22.632 | 23.652 | 25.354 | 28.824 | 30.882 | 33.023 |
Numbers on upward earnings mobility by age indicate that the percentage of individuals with increased earnings over a 2-year span is greater in later years than in earlier years (top panel of Chart 5). Between 1999 and 2000, the probabilities of observing increased earnings for workers aged 65–69 rose by approximately 2 percentage points relative to earlier years, for all ages 65–69. Individuals with increased earnings can be decomposed into (1) those whose earnings rose from zero to a positive amount and (2) those who had positive earnings followed by even larger earnings. The first component of earnings mobility is equivalent to transitions in work participation from "not working" to "working." The bottom panel of Chart 5 shows the second component of earnings mobility. Results indicate that most of the increases in earnings between 1999 and 2000 are attributable to higher earnings among those who were already working. This result is more convincing than results based on pooled cross-sectional data because it comes from comparing earnings of the same individual over 2 consecutive years.
Probability of an increase in earnings between t1 and t2 for those aged 65–69, by age at end of t1
| Age at end of t1 | t1=1996 t2=1997 |
t1=1997 t2=1998 |
t1=1998 t2=1999 |
t1=1999 t2=2000 |
t1=2000 t2=2001 |
t1=2001 t2=2002 |
t1=2002 t2=2003 |
|---|---|---|---|---|---|---|---|
| Earnings at t1 are greater than or equal to zero | |||||||
| 65 | 16.58 | 17.36 | 17.73 | 19.44 | 19.35 | 18.37 | 18.40 |
| 66 | 14.75 | 15.91 | 16.20 | 18.10 | 17.74 | 17.08 | 16.32 |
| 67 | 13.30 | 13.89 | 14.10 | 16.23 | 15.56 | 14.57 | 14.95 |
| 68 | 11.10 | 12.01 | 11.99 | 13.70 | 13.86 | 13.46 | 13.01 |
| 69 | 9.97 | 10.41 | 11.01 | 11.57 | 11.69 | 11.16 | 11.19 |
| Earnings at t1 are greater than zero | |||||||
| 65 | 14.38 | 15.26 | 15.41 | 16.65 | 17.36 | 16.53 | 16.38 |
| 66 | 12.68 | 13.66 | 14.17 | 15.18 | 15.92 | 15.22 | 14.33 |
| 67 | 11.27 | 12.01 | 12.16 | 13.85 | 13.86 | 12.84 | 13.04 |
| 68 | 9.52 | 10.51 | 10.42 | 11.39 | 12.36 | 11.93 | 11.42 |
| 69 | 8.56 | 8.93 | 9.29 | 9.64 | 10.09 | 9.92 | 9.87 |
Regression Analysis
Conventional regression analysis based on average earnings fails to detect the effect of the earnings test removal on earnings. But by analyzing the effects over different percentiles of the earnings distribution, as is shown here, we find statistically significant effects of the test's removal in a way that is exactly as economists would predict.
Our regression analysis is based on a standard difference-in-difference model. We estimate the effects of the earnings test removal in 2000 on work participation, benefit entitlement, and earnings using probit, ordinary least squares (OLS), truncated, and quantile regressions. Details are available in Song and Manchester (2006).
Estimated Effects on Work Participation
Our results show that the work participation rate among individuals who have attained ages 65–69 increased by 0.8 to 2.0 percentage points following the earnings test removal in 2000. Results further show that those effects increased over the study period.
Finding a gradual increase in the effect of removing the earnings test on work participation is not surprising, for several reasons. Returning to the labor market may require a difficult and costly job search for those aged 65–69. Thus, estimated effects immediately following the removal probably understate the longer-run effect. However, additional years of job search may not significantly affect the work participation of those older workers, because their declining health and outdated skill levels constrain their labor market choices. If this is true, then an increase in work participation over time can result from the gradual increase in the number of older workers remaining in the labor market, not from older workers returning to the labor market.
Estimated Effects on Benefit Entitlement
Results from our model suggest that the earnings test removal in 2000 has increased benefit entitlements for those turning age 65 and for those who have attained ages 65–69. The effects tend to increase over the 4 years for the older group, but they are relatively stable for the younger group. Estimated effects indicate that the benefit entitlement rate for the older affected group increased approximately 2 to 5 percentage points after the test's removal.18 It increased approximately 3 to 7 percentage points for the younger group.
Estimated Effects on Earnings
Our results using a reduced-form, truncated regression specification of the difference-in-difference model suggest that earnings increased approximately 4 percent to 10 percent per year among working individuals. Effects in 2000 appear to be much smaller than effects in 2001–2003.19 Such a result seems plausible for persons who have attained ages 65–69, because the law was enacted in April 2000 and older people may need time to respond. Effects on earnings for individuals turning 65 are also found; estimates for 2000–2003 lie between 5 percent and 8 percent.
Previous research using standard regression analysis shows that the average earnings of persons who have attained ages 65–69 were not affected by the earnings test removal (see Gruber and Orszag 2003). However, quantile regression methods permit us to focus on specific percentiles of the earnings distribution.20 We report results based on quantile regression in Table 2. The results show that the removal of the earnings test has increased earnings for working individuals who have attained ages 65–69 at the 60th percentile of the earnings distribution in 2000, 60th to 70th percentiles in 2001, and 60th to 80th percentiles in 2002 and 2003 by statistically significant amounts. Such results indicate that the effects are uneven across the earnings distribution. At the 60th percentile, earnings in 2001, 2002, and 2003 are increased by $734 (6 percent), $1,066 (9 percent), and $1,138 (9 percent), respectively. At the 70th percentile, earnings in 2000, 2001, 2002, and 2003 are increased by $180 (1 percent), $966 (6 percent), $1,460 (9 percent), and $1,670 (10 percent), respectively. Earnings at the 80th percentile in 2001–2003 also increase by similar amounts. Our quantile regression results based on persons with positive earnings indicate that the effects on earnings are concentrated around the 60th to 80th percentiles of the earnings distribution. It turns out that the earnings test threshold in 1999 ($15,500) is just around the 80th percentile for nonwhite females aged 65–69 and between the 60th and 70th percentile for white males aged 65–69.21 These results indicate that the removal of the earnings test has affected the earnings distribution just below the test threshold and up, as we would expect.
| Variable | Quantile regression | Ordinary least squares | |||||
|---|---|---|---|---|---|---|---|
| 0.4 | 0.5 | 0.6 | 0.7 | 0.8 | 0.9 | ||
| Effects on those who have attained ages 65–69 | |||||||
| Constant |
8.7451 (0.1564) |
10.4437 (0.1523) |
12.5956 (0.1986) |
16.0643 (0.2661) |
22.1667 (0.3703) |
35.3851 (0.5893) |
11.5920 (0.7176) |
| Treatment dummy, 2000 |
-0.1956 (0.1704) |
-0.0847 (0.1622) |
0.4013 (0.2163) |
0.1802 (0.2863) |
-0.1921 (0.4263) |
-1.4246 (0.8158) |
0.0291 (0.8684) |
| Treatment dummy, 2001 |
-0.2646 (0.1694) |
0.1469 (0.1687) |
0.7335 (0.2161) |
0.9565 (0.3102) |
1.2221 (0.4273) |
-0.5214 (0.6319) |
0.5189 (0.8616) |
| Treatment dummy, 2002 |
-0.3165 (0.1507) |
0.1112 (0.2053) |
1.0662 (0.2809) |
1.4596 (0.2971) |
1.4536 (0.4973) |
-0.6260 (0.7177) |
-0.7408 (0.8528) |
| Treatment dummy, 2003 |
-0.5580 (0.2203) |
0.0609 (0.1657) |
1.1379 (0.2566) |
1.6702 (0.2864) |
1.5430 (0.4734) |
-0.6693 (0.8642) |
0.0322 (0.8444) |
| Effects on those turning age 65 | |||||||
| Constant |
10.7848 (0.1776) |
12.5908 (0.1718) |
16.4331 (0.2936) |
21.9045 (0.3609) |
30.3644 (0.4686) |
43.1540 (0.7872) |
16.8818 (0.9468) |
| Treatment dummy, 2000 |
0.8382 (0.2543) |
1.5987 (0.4175) |
1.6765 (0.4982) |
1.5675 (0.5302) |
1.2879 (0.6200) |
1.1383 (0.8661) |
-1.2780 (1.4282) |
| Treatment dummy, 2001 |
0.3256 (0.3364) |
1.5221 (0.3633) |
1.7235 (0.4453) |
1.4488 (0.5336) |
0.3402 (0.6856) |
-0.1752 (1.2814) |
-1.3841 (1.4169) |
| Treatment dummy, 2002 |
0.5874 (0.3308) |
2.3427 (0.2967) |
2.5045 (0.3754) |
1.9187 (0.5043) |
0.5939 (0.7411) |
0.3488 (1.4093) |
-1.3584 (1.4012) |
| Treatment dummy, 2003 |
0.6025 (0.2295) |
2.1035 (0.3859) |
2.3703 (0.5114) |
2.8352 (0.5456) |
0.9764 (0.9951) |
1.1521 (1.4436) |
0.9228 (1.3781) |
| SOURCE: Author's estimates. | |||||||
| NOTES: The dependent variable is annual earnings in thousands of dollars.
The sample includes observations with nonzero earnings.
Numbers in parentheses are standard errors. Standard errors are calculated by bootstrap resampling with 40 repetitions.
Other covariates used in this regression are constant, male, race (white), age group dummies (62–64 and 70–72), and calendar-year dummies from 1996 through 2002.
|
|||||||
Again, the estimates using standard regression analysis (OLS) show no effects on earnings for the younger affected group—persons turning age 65. However, results based on quantile regressions for those who have positive earnings indicate that the test's removal affects the 40th to 80th percentiles of earnings in 2000, the 50th to 70th percentiles in 2001 and 2002, and the 40th to 70th percentiles in 2003. At the 60th percentile, earnings in 2000–2003 increased by $1,677 (10 percent), $1,724 (11 percent), $2,505 (15 percent), and $2,370 (14 percent), respectively. Note that the estimated effects are larger for persons who are turning age 65 than for those who have attained ages 65–69. This result is not surprising, because the younger age group not only has better health and skills but also has more choices in the labor market. Again, the percentiles at which the effects are significant correspond to the earnings test threshold for persons attaining age 65.
In both affected groups, we found small and sometimes negative estimates at the 90th percentile of earnings, suggesting that high-income workers might reduce their earnings as the tax bite declines. However, examining the effect on an individual's earnings using quantile regression alone seems inappropriate because the upper earnings test threshold, where all benefits are withheld, depends on family benefit amounts and not just the primary worker's earnings. That is, unlike the lower earnings test threshold, the upper threshold varies by individual. We cannot be sure of the effect of the earnings test removal on workers at the 90th percentile. To precisely measure the effects on earnings of high earners, we would need to identify those who earn above the upper threshold, taking the family benefit amounts into consideration. Thus, our small and statistically insignificant effects at the 90th percentile are not surprising.
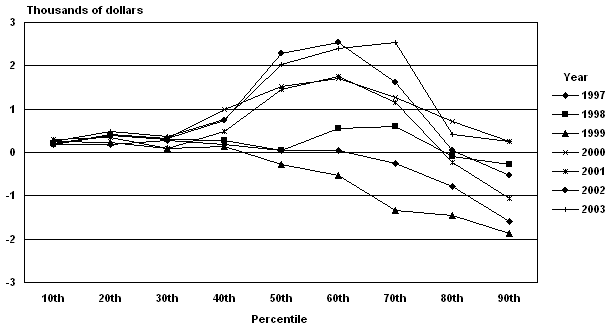
Finally, for purposes of a simple specification test, we estimate quantile regressions by including interaction dummies for 1997–2003 and plot point estimates of those effects by year and percentile (Chart 6). If our regression model identifies the effect of the earnings test removal, coefficient estimates of false treatment dummies would each equal zero. The chart shows (1) how the earnings distributions of the affected groups have evolved since 1996 after controlling for both time and group effects and (2) that the earnings distributions of the treatment groups during the preremoval period have not changed significantly from those of 1996, thereby lending support to the specification of our model. For persons who have attained ages 65–69, earnings at the 60th to 80th percentiles of the distributions during the postremoval period clearly contrast with earnings of the preremoval period. Similarly, earnings at the 50th to 70th percentiles of the distributions for persons turning 65 are clearly affected by the test's removal. More important, estimates for the years before the removal of the earnings test (1997–1999) are located near the horizontal line that indicates an estimate of zero. If our estimates captured effects caused by factors other than the earnings test removal, we would not expect to see the observed pattern of changes in the earnings distributions of the affected groups.
Estimates of the effects on earnings, by percentile and year
| Percentile | 1997 | 1998 | 1999 | 2000 | 2001 | 2002 | 2003 |
|---|---|---|---|---|---|---|---|
| Those who have attained aged 65–69 | |||||||
| 10th | 0.00056 | 0.03683 | -0.02053 | 0.02908 | -0.07619 | -0.00565 | -0.11714 |
| 20th | -0.20244 | -0.29371 | -0.34971 | -0.32041 | -0.53094 | -0.44509 | -0.54072 |
| 30th | -0.16369 | -0.36904 | -0.47323 | -0.67247 | -0.63701 | -0.74058 | -0.9167 |
| 40th | -0.34477 | -0.52449 | -0.59893 | -0.5643 | -0.6323 | -0.69133 | -0.92513 |
| 50th | -0.31006 | -0.65198 | -0.67478 | -0.48731 | -0.24625 | -0.28436 | -0.34423 |
| 60th | -0.32557 | -0.36787 | -0.31126 | 0.13524 | 0.46723 | 0.80307 | 0.869911 |
| 70th | -0.25869 | -0.61414 | -0.81221 | -0.23893 | 0.533749 | 1.039548 | 1.249459 |
| 80th | -0.21848 | -0.75587 | -0.99323 | -0.65697 | 0.746954 | 0.985767 | 1.06506 |
| 90th | -0.15816 | -1.30889 | -1.83359 | -2.23557 | -1.32472 | -1.42702 | -1.45545 |
| Those turning age 65 | |||||||
| 10th | 0.17485 | 0.20848 | 0.2435 | 0.19588 | 0.31106 | 0.18193 | 0.26088 |
| 20th | 0.194055 | 0.384275 | 0.23257 | 0.410235 | 0.339365 | 0.396805 | 0.47337 |
| 30th | 0.27262 | 0.29078 | 0.08286 | 0.317939 | 0.081929 | 0.32398 | 0.36899 |
| 40th | 0.1762 | 0.2872 | 0.127579 | 0.99647 | 0.484259 | 0.744749 | 0.75802 |
| 50th | 0.051597 | 0.041761 | -0.27601 | 1.532 | 1.445913 | 2.27664 | 2.035078 |
| 60th | 0.049531 | 0.547431 | -0.54001 | 1.70617 | 1.759881 | 2.538312 | 2.399152 |
| 70th | -0.2506 | 0.589625 | -1.3417 | 1.278448 | 1.159056 | 1.625686 | 2.544241 |
| 80th | -0.77987 | -0.09979 | -1.45721 | 0.711451 | -0.22342 | 0.035698 | 0.415678 |
| 90th | -1.59195 | -0.27562 | -1.87307 | 0.257538 | -1.05071 | -0.53049 | 0.260109 |
Notes
1. The FRA has been 65 for those who reach 62 in 1999 or earlier, and it gradually increases to 67 for beneficiaries who reach age 62 in 2022 or later. The law was enacted April 7, 2000, but the elimination of the earnings test for beneficiaries was effective for taxable years ending after December 31, 1999. Earnings tests for individuals aged 75 or older, 72–74, and 70–71 were eliminated in 1950, 1954, and 1983, respectively (Social Security Administration, Annual Statistical Supplement to the Social Security Bulletin, 2003 [2004]).
2. Song (2003/2004) also examined the 2000 earnings test removal but used the Social Security Administration's administrative data matched with the Survey of Income and Program Participation (SIPP). That analysis focused on the initial impact of the removal of the test by covering only the first year following the removal.
3. See Social Security Administration, Annual Statistical Supplement to the Social Security Bulletin, 2003 (2004, 240–241) for a brief history of changes in the retirement earnings test.
4. The removal eliminated the test beginning with the month a beneficiary reaches the FRA. Note that the FRA gradually increases beginning with individuals born in 1938 or later. Since those who were born in 1938 reach the FRA in 2003, most of them (those born in March or later because the FRA is 65 and 2 months for the 1938 cohort) are subject to the 62–64 earnings test through 2002 and the modified earnings test in 2003.
5. The benefit recomputation after initial entitlement is not directly associated with the earnings test. The benefit recomputation is relevant if eliminating the earnings test affects earnings and if the new earnings are substantially higher than the lowest earnings in the current benefit computation.
6. For persons claiming early benefits, monthly benefits are reduced from the full benefit amount at the rate of 5/9 of 1 percent per month for the first 36 months and 5/12 of 1 percent for any additional months. The delayed retirement credit for those who reach age 65 in 2005–2006 is 2/3 of 1 percent for each incremental month (or 8 percent per year).
7. Work by a person entitled only to dependent benefits would not increase his or her benefit.
8. Monthly benefits are reduced by the amount of excess earnings beginning with the first month of the year in which the individual is entitled to benefits. In the first year that an individual is entitled to monthly benefits, benefits will not be reduced because of the retirement earnings test for any month that is a nonservice month, regardless of the amount of annual earnings for the year. A nonservice month is a month in which a person's earnings from employment do not exceed 1/12 of the annual exempt amount and he or she does not perform substantial services in self-employment. For persons reaching the FRA, only earnings before the month of attaining the FRA are counted for purposes of the test.
9. The earnings test does not apply to individuals who are entitled to disability benefits or who are living outside the United States and their work is not covered by Social Security. The foreign work test can be applied to persons under the FRA who reside outside the United States. See Social Security Administration (2004).
10. Some examples are Blinder, Gordon, and Wise (1980), Burkhauser and Turner (1981), Reimers and Honig (1993), Vroman (1985), Burtless and Moffitt (1985), Gustman and Steinmeier (1985, 1991), and Packard (1990).
11. There are two versions of the Continuous Work History Sample: an active file and an inactive file. The active file includes individuals with earnings from any employment, whether from covered or noncovered work.
12. For further discussions on the Master Earnings File, the Master Beneficiary Record, and other SSA administrative files, see Panis and others (2000).
13. For those who are attaining the FRA, earnings up to the month before reaching the FRA are counted for purposes of the earnings test.
14. For the sample used in this article, the FRA is 65 except for those born in 1938 or later. The 1938 birth cohort reaches the FRA in 2003 if born in October or earlier, or in 2004 if born in November or December. Thus, defining the control and treatment groups on the basis of age appears to be inconsistent with the rules in 2003. However, the FRA was 65 during the preremoval period considered in this article. To maintain consistency throughout the study period, we keep the definition of the control and treatment groups partitioned by age for the rest of this analysis. We would expect to detect any anomalies arising from the FRA change by including year-by-year dummies in the analysis rather than one posttreatment dummy.
15. For example, those who were born in 1936 through 1938 are turning 62–64 in 2000, and those who were born in 1927 through 1929 have attained ages 70–72 as of December 31, 1999. Those who were born in 1935 are turning 65 in 2000, and those who were born in 1930 through 1934 have attained ages 65–69 as of December 31, 1999. In 2000, therefore, the modified earnings test applies for those who were born in 1935, but the test no longer applies to those who were born in 1930 through 1934.
16. A person becomes entitled to benefits when he or she applies, is deemed to be eligible, and is awarded benefits.
17. We further discuss how our estimates may be affected by the changes in the FRA for the 62–64 age group in the full version of the paper (Song and Manchester 2006).
18. The estimated increase in benefit claims of 2.2 percentage points in 2000 following the test's removal is not surprising and appears to be consistent with the result reported in Song (2003/2004). The estimated magnitude of 2 to 5 percentage points may not seem large, but it indicates a rather large impact on benefit claims among those who had not yet become beneficiaries by age 65. Only 10 percent of those who had attained ages 65–69 had not yet claimed old-age benefits before 2000.
19. Because the rule was changed in April 2000 and effective retroactively from January 2000, relatively small effects in 2000 are not surprising.
20. See Buchinsky (1998) for the interpretation of quantile regression estimates.
21. Note that 88 percent of persons in our sample are white and 54 percent are male.
References
Blinder, A., R. Gordon, and D. Wise. 1980. Reconsidering the work disincentive effects of Social Security. National Tax Journal 33(4): 431–442.
Buchinsky, Moshe. 1998. Recent advances in quantile regression models: A practical guideline for empirical research. Journal of Human Resources 33(1): 88–126.
Burkhauser, Richard V., and John Turner. 1981. Can twenty-five million Americans be wrong? A response to Blinder, Gordon, and Wise. National Tax Journal 34(4): 467–472.
Burtless, Gary, and Robert A. Moffitt. 1985. The joint choice of retirement age and postretirement hours of work. Journal of Labor Economics 3(2): 209–236.
Friedberg, Leora. 2000. The labor supply effects of the Social Security earnings test. Review of Economics and Statistics 82(1): 48–63.
Gruber, Jonathan, and Peter Orszag. 2003. Does the Social Security earnings test affect labor supply and benefit receipt? National Tax Journal 56(4): 755–773.
Gustman, Alan L., and Thomas L. Steinmeier. 1985. The 1983 Social Security reforms and labor supply adjustments of older individuals in the long run. Journal of Labor Economics 3(2): 237–253.
———. 1991. Changing the Social Security rules for work after 65. Industrial and Labor Relations Review 44(4): 733–745.
Loughran, David, and Steven Haider. 2005. Do the elderly respond to taxes on earnings? Evidence from the Social Security retirement earnings test. Working Paper WR-223, RAND, Santa Monica, CA.
Packard, Michael D. 1990. The earnings test and the short-run work response to its elimination. Social Security Bulletin 53(9): 2–16.
Panis, Constantijn, Roald Euller, Cynthia Grant, Melissa Bradley, Christine E. Peterson, Randall Hirscher, and Paul Stinberg. 2000. SSA Program Data User's Manual. Baltimore, MD: Social Security Administration.
Reimers, Cordelia, and Marjorie Honig. 1993. The perceived budget constraint under Social Security: Evidence from reentry behavior. Journal of Labor Economics 11(1): 184–204.
Social Security Administration. 2004. Annual Statistical Supplement to the Social Security Bulletin. Washington, DC: SSA, Office of Policy, Office of Research, Evaluation, and Statistics.
Song, Jae G. 2003/2004. Evaluating the initial impact of the elimination of the retirement earnings test. Social Security Bulletin 65(1): 1–15.
Song, Jae G., and Joyce Manchester. 2006. New evidence on earnings and benefit claims following the changes in the retirement earnings test in 2000. ORES Working Paper 107, Social Security Administration, Office of Policy, Office of Research, Evaluation, and Statistics, Washington, DC (July). Also available in Journal of Public Economics 91(3–4): 669–700 (2007).
Vroman, Wayne. 1985. Some economic effects of the Social Security retirement earnings test. In Research in Labor Economics, edited by Ronald Ehrenberg, 31–89. Greenwich, CT: JAI Press.