Distributional Effects of Raising the Social Security Payroll Tax
Policy Brief No. 2010-01 (released April 2010)
This policy brief analyzes the lifetime tax effects of two options for addressing the Social Security system's long-range solvency by raising the Social Security payroll tax rate. The first, an immediate increase, would have raised the payroll tax rate from its current 12.4 percent to 14.4 percent in 2006; the second, a phased increase, would raise the payroll tax rate to 14.5 percent in 2020, and then to 16.6 percent in 2050. The brief also analyzes a comparative scenario in which the current tax rate is maintained through 2041 and then raised each year as needed to pay scheduled benefits. The lifetime taxes of people born 1936–2015 are analyzed using Modeling Income in the Near Term (MINT) projections. Results show that the longer a tax rate increase is delayed, the fewer workers are affected, but also the higher the increase in lifetime taxes for later generations. The results also show that both options reduce the cross-cohort variability in the ratio of benefits received to taxes paid.
Dave Shoffner is with the Social Security Administration's (SSA's) Office of Retirement and Disability Policy. Questions about this analysis should be directed to the author at (202) 358-6210.
Acknowledgments: The author thanks Melissa Knoll, Brad Trenkamp, Mark Sarney, David Weaver, Jason Fichtner, Anya Olsen, Chris Tamborini, Kevin Whitman, Pat Vinkenes, Glenn Springstead, Gayle Reznik, Amy Shuart, and Emily Cupito for their helpful comments and suggestions.
The findings and conclusions presented in this brief are those of the author and do not necessarily represent the views of the Social Security Administration.
Summary
| MINT | Modeling Income in the Near Term |
| OCACT | Office of the Chief Actuary |
This policy brief analyzes the lifetime tax effects of two options for addressing the Social Security system's long-range solvency by raising the Social Security payroll tax rate. These options were included in the Social Security Advisory Board's 2005 list of potential reforms.1 The first, an immediate increase, would have raised the payroll tax rate from its current 12.4 percent to 14.4 percent in 2006; the second, a phased increase, would raise the payroll tax rate to 14.5 percent in 2020, and then to 16.6 percent in 2050. Because there would be no changes in benefits under either option, this brief focuses on taxes. The lifetime taxes paid under the two options are compared with a scenario in which the tax rate would remain at 12.4 percent until 2042, when trust fund assets are projected to be exhausted; thereafter, tax rates would be increased as needed to pay scheduled benefits.2
Methodology
The estimated long-term solvency effects of these payroll tax increases are from the Social Security Administration's Office of the Chief Actuary (OCACT) and are based on economic and demographic assumptions from the 2005 Trustees Report.3 The distributional analysis is based on projections from the version of the Modeling Income in the Near Term (MINT) model that uses 2004 Trustees Report assumptions.4 Although OCACT has since updated its solvency estimates, this brief uses the 2005 estimates so that the solvency and distributional results are based on underlying assumptions from Trustees Reports that are as similar as possible. Therefore, in this analysis, the immediate tax increase starts in 2006, and the phased tax increases are introduced in 2020 and 2050.5
MINT projections for individuals born 1926–1965 are based on actual Survey of Income and Program Participation (SIPP) respondents surveyed 1990–1996. Projections for individuals born 1966–2017 are simulated based on earlier SIPP cohorts adjusted to match expected changes in demographic and economic trends. Only 1936–2015 cohorts are analyzed in this brief. The 1926–1935 cohorts are omitted because most people in these cohorts would have stopped working by 2006 and would be unaffected by the options. The 2016–2017 cohorts are left out so that the remaining cohorts can be organized into 5-year groupings, from 1936–1940 to 2011–2015.
Major Findings
Each option (immediate and phased) would close the 75-year actuarial deficit and would raise lifetime taxes about 10 percent, compared with an 8 percent increase under the as-needed scenario. Neither the immediate nor the phased option would achieve sustainable solvency, however.
The longer a rate increase is delayed, the fewer workers are affected. The immediate option would affect 92 percent of workers, compared with 78 percent under the phased option and 48 percent under the as-needed scenario.
However, the longer a rate increase is delayed, the higher the increase in lifetime taxes for later generations. Workers born 1936–1990 would typically have higher increases in lifetime taxes under an immediate rate increase, workers born 1996–2005 would generally have higher increases in lifetime taxes under phased increases, and workers born 2006–2015 would have higher increases in lifetime taxes under as-needed increases.
Future workers would experience the smallest tax increases under the immediate option. Lifetime taxes for workers born 2011–2015 would rise 16 percent under an immediate increase, 27 percent under phased increases, and 33 percent under as-needed increases.
Neither option would eliminate intergenerational inequities, but both would reduce the cross-cohort variability in the ratio of benefits received to taxes paid that is seen under as-needed tax increases.
Both Options Would Increase the Tax Rate at Different Times and to Different Levels
The current-law Social Security payroll tax rate is 12.4 percent of covered earnings6 up to $106,8007 and is split evenly between employers and employees.8 The tax rate has changed frequently since Social Security began. In 1937, the first year taxes were collected, the rate was 2.0 percent; it has been 12.4 percent since 1990.9
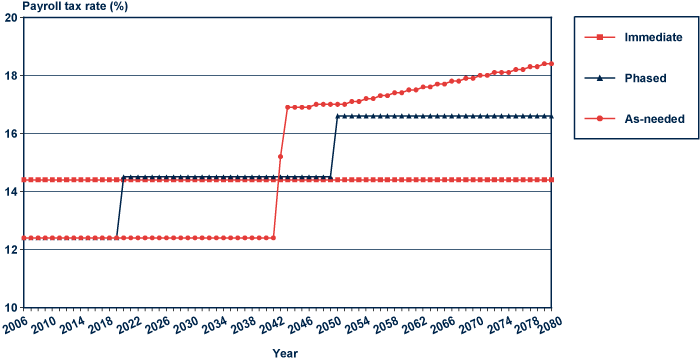
The immediate option would raise the 12.4 percent rate to 14.4 percent in 2006. The phased option would maintain the current tax rate through 2019, raise it to 14.5 percent in 2020, and then raise it to 16.6 percent in 2050. The as-needed scenario would maintain the current tax rate through 2041 and then raise the tax rate each year thereafter, beginning with 15.2 percent in 2042 and ultimately reaching 18.4 percent in 2080. The annual payroll tax rates for the two options and the as-needed scenario are shown in Chart 1.
Social Security payroll tax rates under alternative policy options, 2006–2080

| Year | Immediate increase | Phased increases | As-needed increases |
|---|---|---|---|
| 2006 | 14.4 | 12.4 | 12.4 |
| 2007 | 14.4 | 12.4 | 12.4 |
| 2008 | 14.4 | 12.4 | 12.4 |
| 2009 | 14.4 | 12.4 | 12.4 |
| 2010 | 14.4 | 12.4 | 12.4 |
| 2011 | 14.4 | 12.4 | 12.4 |
| 2012 | 14.4 | 12.4 | 12.4 |
| 2013 | 14.4 | 12.4 | 12.4 |
| 2014 | 14.4 | 12.4 | 12.4 |
| 2015 | 14.4 | 12.4 | 12.4 |
| 2016 | 14.4 | 12.4 | 12.4 |
| 2017 | 14.4 | 12.4 | 12.4 |
| 2018 | 14.4 | 12.4 | 12.4 |
| 2019 | 14.4 | 12.4 | 12.4 |
| 2020 | 14.4 | 14.5 | 12.4 |
| 2021 | 14.4 | 14.5 | 12.4 |
| 2022 | 14.4 | 14.5 | 12.4 |
| 2023 | 14.4 | 14.5 | 12.4 |
| 2024 | 14.4 | 14.5 | 12.4 |
| 2025 | 14.4 | 14.5 | 12.4 |
| 2026 | 14.4 | 14.5 | 12.4 |
| 2027 | 14.4 | 14.5 | 12.4 |
| 2028 | 14.4 | 14.5 | 12.4 |
| 2029 | 14.4 | 14.5 | 12.4 |
| 2030 | 14.4 | 14.5 | 12.4 |
| 2031 | 14.4 | 14.5 | 12.4 |
| 2032 | 14.4 | 14.5 | 12.4 |
| 2033 | 14.4 | 14.5 | 12.4 |
| 2034 | 14.4 | 14.5 | 12.4 |
| 2035 | 14.4 | 14.5 | 12.4 |
| 2036 | 14.4 | 14.5 | 12.4 |
| 2037 | 14.4 | 14.5 | 12.4 |
| 2038 | 14.4 | 14.5 | 12.4 |
| 2039 | 14.4 | 14.5 | 12.4 |
| 2040 | 14.4 | 14.5 | 12.4 |
| 2041 | 14.4 | 14.5 | 12.4 |
| 2042 | 14.4 | 14.5 | 15.2 |
| 2043 | 14.4 | 14.5 | 16.9 |
| 2044 | 14.4 | 14.5 | 16.9 |
| 2045 | 14.4 | 14.5 | 16.9 |
| 2046 | 14.4 | 14.5 | 16.9 |
| 2047 | 14.4 | 14.5 | 17.0 |
| 2048 | 14.4 | 14.5 | 17.0 |
| 2049 | 14.4 | 14.5 | 17.0 |
| 2050 | 14.4 | 16.6 | 17.0 |
| 2051 | 14.4 | 16.6 | 17.0 |
| 2052 | 14.4 | 16.6 | 17.1 |
| 2053 | 14.4 | 16.6 | 17.1 |
| 2054 | 14.4 | 16.6 | 17.2 |
| 2055 | 14.4 | 16.6 | 17.2 |
| 2056 | 14.4 | 16.6 | 17.3 |
| 2057 | 14.4 | 16.6 | 17.3 |
| 2058 | 14.4 | 16.6 | 17.4 |
| 2059 | 14.4 | 16.6 | 17.4 |
| 2060 | 14.4 | 16.6 | 17.5 |
| 2061 | 14.4 | 16.6 | 17.5 |
| 2062 | 14.4 | 16.6 | 17.6 |
| 2063 | 14.4 | 16.6 | 17.6 |
| 2064 | 14.4 | 16.6 | 17.7 |
| 2065 | 14.4 | 16.6 | 17.7 |
| 2066 | 14.4 | 16.6 | 17.8 |
| 2067 | 14.4 | 16.6 | 17.8 |
| 2068 | 14.4 | 16.6 | 17.9 |
| 2069 | 14.4 | 16.6 | 17.9 |
| 2070 | 14.4 | 16.6 | 18.0 |
| 2071 | 14.4 | 16.6 | 18.0 |
| 2072 | 14.4 | 16.6 | 18.1 |
| 2073 | 14.4 | 16.6 | 18.1 |
| 2074 | 14.4 | 16.6 | 18.1 |
| 2075 | 14.4 | 16.6 | 18.2 |
| 2076 | 14.4 | 16.6 | 18.2 |
| 2077 | 14.4 | 16.6 | 18.3 |
| 2078 | 14.4 | 16.6 | 18.3 |
| 2079 | 14.4 | 16.6 | 18.4 |
| 2080 | 14.4 | 16.6 | 18.4 |
Each Option Would Achieve 75-Year Solvency, but Not Sustainable Solvency
Both options would eliminate over 100 percent of the currently projected 75-year long-range actuarial deficit, as shown in Table 1. Taxes received and trust fund reserves would together provide enough funding to pay scheduled benefits every year through 2080. A small amount of trust fund reserves would be available after 2080. In the 75th year, both options would reduce a portion of the currently projected annual shortfall between taxes received and benefits paid, and both also would rely partly on trust fund reserves built up in earlier years to pay scheduled benefits. The as-needed scenario, meanwhile, would use all trust fund reserves by 2042 and then would continue funding scheduled benefits through yearly increases in the payroll tax rate. Under immediate and phased increases, further changes to taxes or benefits would be needed soon after 2080 to keep the Social Security system solvent. In the as-needed scenario, tax rates would continue to be adjusted each year after 2080 to enable income to equal costs. It is worth noting, however, that the shortfall between taxes received and benefits paid in the 75th year would be smaller under phased increases than under an immediate increase, because the phased option would collect more taxes in later years than the immediate option.
| Effect | Immediate payroll tax increase | Phased payroll tax increases |
|---|---|---|
| Change in actuarial balance as a percentage of taxable payroll | 1.96 | 1.98 |
| Percentage of long-range actuarial deficit eliminated | 102.10 | 103.10 |
| Percentage of annual shortfall in the 75th year eliminated | 35.10 | 73.90 |
| SOURCE: Social Security Administration Office of the Chief Actuary. | ||
| NOTE: Percentages represent the difference relative to a continuation of current law and policies. | ||
Because there would be no changes in benefits, this brief focuses on the lifetime effect of payroll tax increases by examining the effects of the options across 5-year birth cohorts. Those born in 1936–1940 were aged 66–70 in 2006, and about 28 percent would have had earnings and paid more taxes when the immediate option began.10 The latest 5-year birth cohort available in this version of MINT includes people born 2011–2015. Individuals in this last cohort will be aged 65–69 in 2080 and 31 percent of them are projected to have earnings, while the rest will have left the work force. Among all people born 1936–2015, the aggregate increase in lifetime taxes paid over current law would be about 10.6 percent under an immediate increase, 10.3 percent under phased increases, and 8 percent under as-needed increases. Given that the overall effects of the two options are very similar, most of this analysis focuses on how timing differences between the two options would affect generations of workers differently. The distributional results below do not include any behavioral responses. Because it is unknown how these tax rate changes would affect labor force participation, this analysis assumes that workers' earnings would not change under the different options.
The Longer a Rate Increase is Delayed, the Fewer Workers are Affected
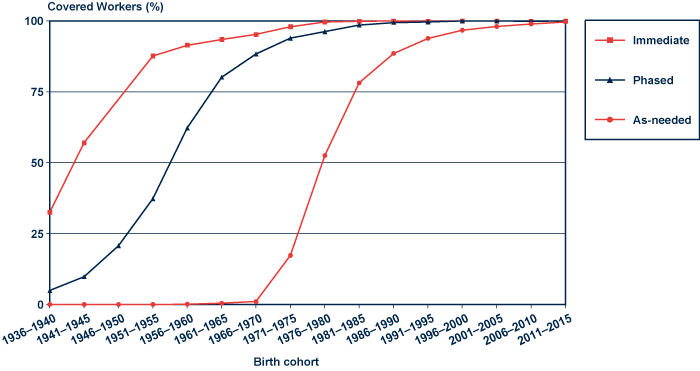
Ninety-two percent of people born between 1936 and 2015 would pay higher taxes in at least 1 year of work under an immediate increase, versus 78 percent under phased increases and 48 percent under as-needed increases. Chart 2 shows that almost no workers born before 1971 would pay at least 1 year of higher taxes under as-needed increases, compared with substantial proportions under the two options.
Percentage of covered workers with at least 1 year of higher Social Security payroll taxes under alternative policy options and for comparative scenario, by birth cohort

| Birth Cohort | Immediate increase | Phased increases | As-needed increases |
|---|---|---|---|
| 1936–1940 | 32.5 | 4.9 | 0.0 |
| 1941–1945 | 57.0 | 9.8 | 0.0 |
| 1946–1950 | 78.3 | 20.7 | 0.0 |
| 1951–1955 | 87.6 | 37.3 | 0.0 |
| 1956–1960 | 91.4 | 62.2 | 0.1 |
| 1961–1965 | 93.4 | 80.1 | 0.4 |
| 1966–1970 | 95.2 | 88.3 | 1.0 |
| 1971–1975 | 97.9 | 93.9 | 17.3 |
| 1976–1980 | 99.6 | 96.2 | 52.5 |
| 1981–1985 | 99.8 | 98.5 | 78.1 |
| 1986–1990 | 99.9 | 99.4 | 88.5 |
| 1991–1995 | 99.8 | 99.6 | 93.8 |
| 1996–2000 | 99.9 | 99.9 | 96.7 |
| 2001–2005 | 99.9 | 99.9 | 98.0 |
| 2006–2010 | 99.8 | 99.8 | 98.9 |
| 2011–2015 | 99.9 | 99.9 | 99.6 |
The Longer a Rate Increase is Delayed, the Higher the Increase for Later Generations
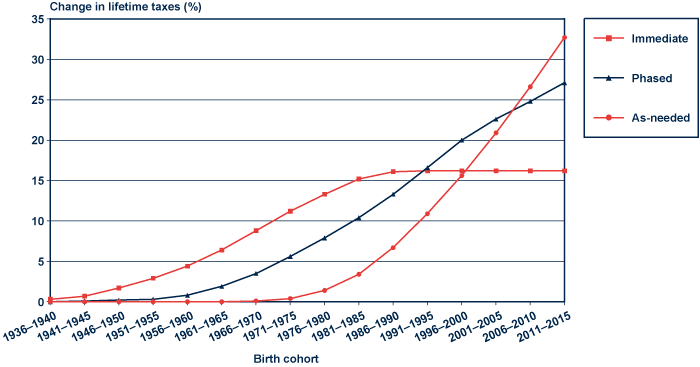
The amount of increase in lifetime taxes among the two options and in the as-needed scenario is driven by timing as well. Almost all workers born before 1971 would have no tax increase under the as-needed scenario and workers born before 2000 would have smaller tax increases under the as-needed scenario than under either option, as shown in Chart 3. However, for those born after 2005, the tax increase under the as-needed scenario would exceed those under either option, and for the 2011–2015 cohort, it would be about 15 percentage points higher than that under the immediate increase. Although the immediate option would increase taxes more for those born before 1991, it would bring about the smallest increase for those born in 1996 and later. The increases under the phased option would generally fall in the middle, with the exception of workers born 1996–2005, who would pay the most under phased increases.
Percentage increase in total lifetime Social Security payroll taxes relative to current-law taxes, by policy option or scenario and birth cohort

| Birth cohort | Immediate increase | Phased increases | As-needed increases |
|---|---|---|---|
| 1936–1940 | 0.3 | 0.0 | 0.0 |
| 1941–1945 | 0.7 | 0.1 | 0.0 |
| 1946–1950 | 1.7 | 0.2 | 0.0 |
| 1951–1955 | 2.9 | 0.3 | 0.0 |
| 1956–1960 | 4.4 | 0.8 | 0.0 |
| 1961–1965 | 6.4 | 1.9 | 0.0 |
| 1966–1970 | 8.8 | 3.5 | 0.1 |
| 1971–1975 | 11.2 | 5.6 | 0.4 |
| 1976–1980 | 13.3 | 7.9 | 1.4 |
| 1981–1985 | 15.2 | 10.4 | 3.4 |
| 1986–1990 | 16.1 | 13.3 | 6.7 |
| 1991–1995 | 16.2 | 16.6 | 10.9 |
| 1996–2000 | 16.2 | 20.0 | 15.6 |
| 2001–2005 | 16.2 | 22.6 | 20.9 |
| 2006–2010 | 16.2 | 24.8 | 26.6 |
| 2011–2015 | 16.2 | 27.1 | 32.7 |
Both Options Would Improve Intergenerational Equity for Most Cohorts
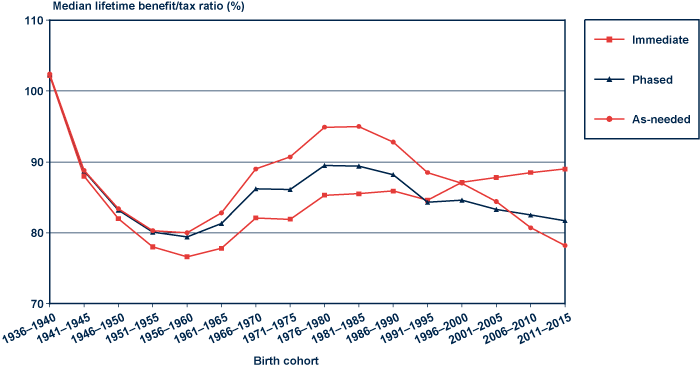
The benefit/tax ratio illustrates how much a worker receives in benefits for each dollar of payroll taxes paid. It is calculated by dividing the present value of lifetime benefits by the present value of lifetime payroll taxes.11 Old-Age and Survivors Insurance (OASI) and Disability Insurance (DI) benefits and taxes are counted. The benefit/tax ratios of all people who pay taxes in their lifetime are included, even if they never receive benefits. Except for the 1936–1940 cohort, both options would improve intergenerational equity by reducing the variability in benefit/tax ratios across generations compared with the range of benefit/tax ratios under as-needed increases, as shown in Chart 4.
Median lifetime Social Security benefit/tax ratios under alternative policy options and for comparative scenario, by birth cohort

| Birth Cohort | Immediate increase | Phased increases | As-needed increases |
|---|---|---|---|
| 1936–1940 | 102.2 | 102.4 | 102.4 |
| 1941–1945 | 88.0 | 88.7 | 88.8 |
| 1946–1950 | 82.0 | 83.2 | 83.4 |
| 1951–1955 | 78.0 | 80.1 | 80.3 |
| 1956–1960 | 76.6 | 79.4 | 80.0 |
| 1961–1965 | 77.8 | 81.3 | 82.8 |
| 1966–1970 | 82.1 | 86.2 | 89.0 |
| 1971–1975 | 81.9 | 86.1 | 90.7 |
| 1976–1980 | 85.3 | 89.5 | 94.9 |
| 1981–1985 | 85.5 | 89.4 | 95.0 |
| 1986–1990 | 85.9 | 88.2 | 92.8 |
| 1991–1995 | 84.6 | 84.3 | 88.5 |
| 1996–2000 | 87.1 | 84.6 | 87.0 |
| 2001–2005 | 87.8 | 83.3 | 84.4 |
| 2006–2010 | 88.5 | 82.5 | 80.7 |
| 2011–2015 | 89.0 | 81.7 | 78.2 |
Once again, the degree of delay in a rate increase drives intergenerational differences in returns from Social Security. Under an immediate increase, those born 1951–1965 would have the lowest median benefit/tax ratio (below 80 percent) but the 2011–2015 cohort would have the highest ratio, almost 90 percent, compared to phased and as-needed increases. The delay in the rate increase under the as-needed scenario would allow the ratio to increase to about 95 percent for those born in the 1980s but would drop below 80 percent for the latest cohorts, more than offsetting their increasing lifetime benefits due to longer life expectancies. Spacing out two rate increases under the phased option, meanwhile, would produce the most equitable deal across generations as almost all birth cohorts would have benefit/tax ratios between 80 percent and 90 percent.
Notes
1 See Social Security: Why Action Should be Taken Soon, available at http://www.ssab.gov/documents/WhyActionShouldbeTakenSoon.pdf.
2 Based on assumptions of the 2004 Annual Report of the Board of Trustees of the Federal Old-Age and Survivors Insurance and Federal Disability Insurance Trust Funds, tax rates would first need to be increased in 2042, when the trust funds would be exhausted. The payroll tax rates needed to fund benefit payments would be 15.2 percent in 2042, 16.9 percent in 2043, and so on until reaching 18.4 percent in 2080. For these estimates, the tax rate would remain constant at 18.4 percent in 2081 and later. The latest birth cohort analyzed (2011–2015) would be aged 65–69 in 2080 and therefore almost all earnings would be complete by then. As with the immediate and phased options, other tax or benefit changes could be implemented after 2080 instead of continuing with as-needed tax increases.
3 OCACT's solvency estimates are on page 4 of a 2005 memorandum, "Estimated OASDI Long-Range Financial Effects of Several Provisions Requested by the Social Security Advisory Board," available at http://www.ssab.gov/documents/advisoryboardmemo--2005tr--08102005.pdf.
4 MINT is based on Social Security administrative data matched to the Survey of Income and Program Participation. Life events such as work, marriage, retirement, and death are projected based on real earnings, marital histories, and education levels. Because this version of MINT does not provide the data needed to calculate children's benefits, the payroll tax rate is reduced to acknowledge that fewer benefits are being financed in the simulation. For example, in 2006, benefits paid to children equaled approximately 5 percent of total benefits paid. Therefore, the 12.4 percent tax rate would be reduced by 5 percent and equal about 11.8 percent. For the options being analyzed, the tax rate increases would first be applied to the 12.4 percent current law rate and then the 5 percent reduction would be applied.
5 Under the most recent OCACT estimates, an immediate increase would raise the tax rate to 14.6 percent in 2010 and phased increases would raise the tax rate to 14.4 percent in 2022 and to 16.4 percent in 2052. See http://www.socialsecurity.gov/OACT/solvency/provisions/payrolltax.html.
6 Over 95 percent of workers are covered by Social Security. The major exceptions are some state and local government employees and some clergy.
7 The taxable cap in 2009 was $106,800. The cap increases annually according to the rate of wage growth in the previous year, provided a cost-of-living adjustment (COLA) is paid to Social Security beneficiaries. For 2010, there is no COLA and the cap remains $106,800.
8 Most economists agree that the combined 12.4 percent tax is effectively paid entirely by the employee. For example, see the "tax incidence" section on page 7 of Dean Leimer's article, "A Guide to Social Security Moneys Worth Issues," available at http://www.socialsecurity.gov/policy/docs/ssb/v58n2/v58n2p3.pdf.
9 Social Security Administration, Annual Statistical Supplement to the Social Security Bulletin, Table 2.A3.
10 Although people born before 1936 could also still be working, only 16 percent of those born 1931–1935 and 8 percent of those born 1926–1930 had earnings in 2006.
11 This measure takes the present value at age 62 of all the benefits that a person will receive while single plus half of the benefits that a person and his or her spouse will receive in years that the two are married. This lifetime shared benefit value is then divided by the present value at age 62 of all the taxes that a person pays while single plus half of the taxes that a person and his or her spouse pay in the years that they are married. Social Security's effective trust fund rate is used as the interest rate for these calculations and is similar to the interest rate earned on treasury bonds. A value of 100 percent or more shows that the Social Security benefits received are worth as much or more than the taxes paid plus interest, while a value of less than 100 percent shows that the benefits received are worth less than the value of taxes paid plus interest.