A comparison of estimated annual SSI program costs to the Gross Domestic Product (GDP)1 is an appropriate relative measure of program costs that produces an inflation-independent measure of the cost of the SSI program. Displaying Federal SSI payments as a percentage of GDP provides a useful perspective on the proportion of the total output of the U.S. economy needed to provide Federal SSI benefits. As table
IV.D1 and figure
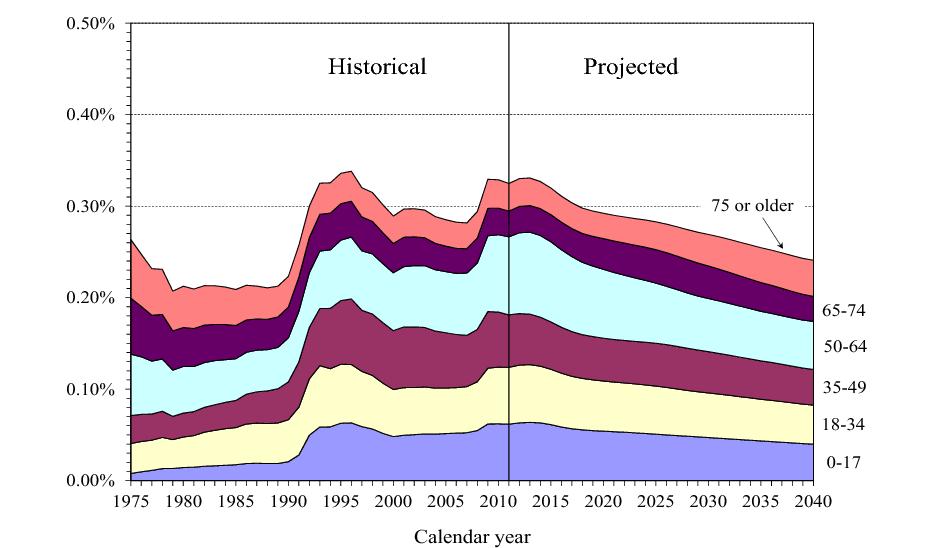
IV.D1 show, we project the total cost of the SSI program relative to GDP to be relatively constant through 2014 and decline thereafter.
Table IV.D1 and figure
IV.D1 present historical and projected Federal expenditures under the SSI program as a percentage of GDP. Although SSI program costs were comparatively higher in the first few years of the program, total Federal SSI payments during the 1980s were relatively constant as a percentage of GDP (0.21 percent). During the early 1990s, SSI grew rather rapidly (to 0.34 percent of GDP in 1996) due to a combination of factors (see section IV.B). Following legislation enacted in 1996
2, the cost of SSI decreased as a percentage of GDP beginning in 1997 and continuing through 2000. The share of GDP devoted to Federal SSI expenditures increased slightly after 2000, partly because of a slowdown in economic growth over that period, but resumed its very gradual downward trend from 2002 to 2007 due to relatively slower growth in the number of SSI recipients. Beginning in 2008, however, this trend reversed due to an increase in program recipients and a temporary decline in nominal GDP during the economic recession. As the economy recovers, we project the gradual downward trend to resume. This ultimate trend is the net effect of two factors. First, we project that Federal SSI expenditures, after adjusting for growth in prices, will show slightly higher growth than the population. This estimate follows from our projection that the SSI recipient population will grow as a percentage of the overall U.S. population (see section IV.C). Second, using the 2012 Trustees Report intermediate assumptions, we project that the effect of the real growth in GDP following the recent economic downturn will be greater than the effect of projected increases in SSI recipients. Accordingly, we project that Federal SSI payments will decline as a percentage of GDP starting in 2014 and over the remainder of the projection period, until it reaches 0.25 percent of GDP by 2036.