| |
An earlier publication in this series1 described the policies and practices governing investment of assets held by the Old-Age and Survivors Insurance (OASI) and the Disability Insurance (DI) Trust Funds. The investment performance of the trust funds is a direct consequence of these investment policies and amounts available for investment. (Such amounts result principally from the net effect of program expenditures and level of program financing provided by legislatively specified tax rates.) Trust fund investment performance can be characterized in a variety of ways. One way is to compute the effective annual rates of interest earned by the fund assets, as was presented in Actuarial Note 138, Effective Annual Interest Rates Earned by the OASI and DI Trust Funds, 1940-96.2 This note addresses two additional characteristics of investment experience since 1991: (1) the average nominal interest rate on assets held by the funds and (2) the average time to maturity, for each of the two Social Security Trust Funds. The financial condition of the two trust funds differed markedly in the first half of the 1990s, and their condition affected the two characteristics examined in this note. In order to illustrate the difference, each characteristic is discussed for each trust fund separately. Investment data are presented here on a monthly basis and were provided by the Bureau of Public Debt in the Department of the Treasury. Appendices A and B summarize these data for the OASI and DI Trust Funds, respectively. In addition, the data are available on the Internet. See http://www.socialsecurity.gov/OACT/ProgData/newIssueRates.html for new-issue interest rates and http://www.socialsecurity.gov/OACT/ProgData/investheld.html for average interest rates and average years to maturity. (The latter site provides data for each trust fund separately or combined.)
Background
As described in Actuarial Note 142, the trust funds are required by law to be invested in securities backed by the full faith and credit of the United States Government. The law also specifies that the investments be managed by the Secretary of the Treasury. For over 20 years, it has been the policy of the Treasury to invest only in securities issued by the Treasury exclusively to the trust funds. These securities are called special issues and bear interest rates according to a formula set by law. The special-issue interest rate is determined on the last business day of each month and then applies to all securities purchased in the following month. The same interest rate applies to new investments in both of the Social Security Trust Funds. The DI Trust Fund still contains some publicly-issued marketable government bonds, but the amount of such marketable securities held is negligible and hence our discussion of securities will refer exclusively to special-issue securities.
By statute, special-issue securities issued to the trust funds are required to have maturities fixed with due regard for the needs of the funds. In practice, this requirement has led to the following policy. Daily investment activity is restricted to short-term certificates of indebtedness (CIs) that mature on the following June 30. At maturity, the CIs are converted to bonds with maturities ranging from 1 to 15 years. If a trust fund is in financial difficulty, the maturity of the bonds so issued may be only 1 year, but the usual practice is to spread the maturities of the new issues so that the total amount (including bonds purchased in earlier years) maturing over each of the next 15 years is uniformly distributed.
One feature of special-issue securities is that they can be redeemed prior to maturity at par value. Because all income to the funds must be invested, such redemption prior to maturity occurs frequently. Redemption follows a hierarchical procedure: (1) redeem securities with the earliest maturities first; (2) for securities with the same maturity date, redeem those with lower interest rates first; and (3) for securities with the same maturity date and the same interest rate, redeem on a first-in-first-out basis.
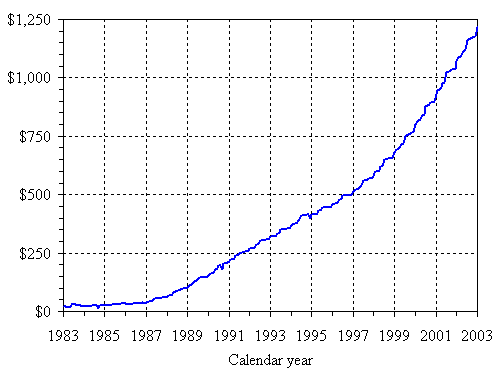
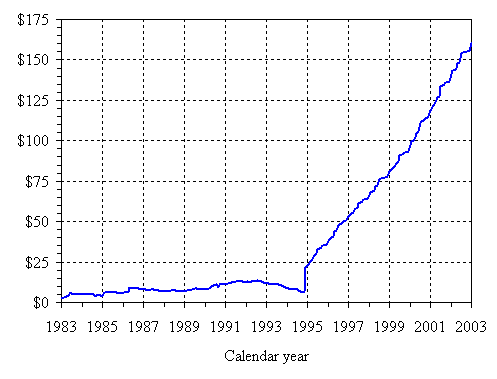
As mentioned above, the other key factor affecting investment results is the pattern of accumulation of trust fund assets. The trust funds, considered on a combined basis, have experienced a period of substantial build-up since the enactment of the 1983 amendments which established the overall financing structure that still prevails. The DI Trust Fund, however, experienced a period of financial distress in the early 1990s which resulted in a reduction of fund assets. DI's financial difficulties led to the enactment of legislation which reallocated a portion of the OASI tax rate to DI. This reallocation, enacted on October 22, 1994, was specified to be retroactive to January 1, 1994, and resulted in a transfer of about $14 billion from OASI to DI in November 1994. Thus, the patterns of asset accumulation over this period have varied significantly by trust fund, as illustrated in figures 1 and 2. Note the scales for the vertical axis in the two figures differ to reflect the relative size difference of the two funds.
Average interest rates
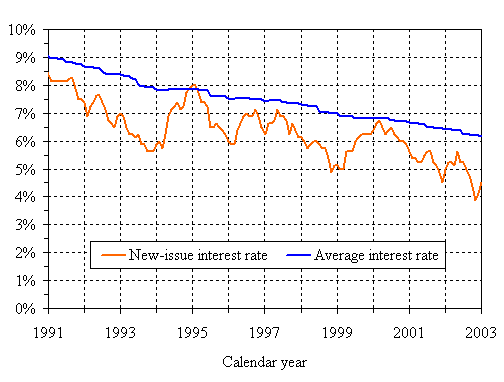
In figure 3, two sets of interest rates are shown for the OASI Trust Fund: the interest rate applicable to special-issue securities acquired throughout a month--the so-called "new-issue interest rate"--and the average interest rate3 on all securities held by the fund at the end of each month. Two observations are readily apparent. First, the new-issue rate shows a downward trend over the period under investigation. Second, as a result of declining new-issue rates, the average rate is generally above the new-issue rate in this period.
The table below shows interest rates on special-issue bonds acquired (new issues) in years 1980-2002. These rates were higher during the 1980s and in 1990 than the rate for January 1991 (8.125 percent). Thus, the average interest rate on all securities held at the beginning of 1991, the bulk of which consisted of bonds acquired in the 1980s and in 1990, was also higher than the new-issue rate for 1991. Then, as interest rates on new securities declined in the 1990s, the fund's portfolio gradually acquired lower-rate securities and its higher-rate securities matured. But the weighted average for all its securities--which is the average rate shown in figure 3--generally remained higher than the new-issue rate because (1) the fund still held high-rate bonds acquired in the 1980s, and (2) the redemption policy requires that, for securities with the same maturity date, those with lower interest rates must be redeemed first.
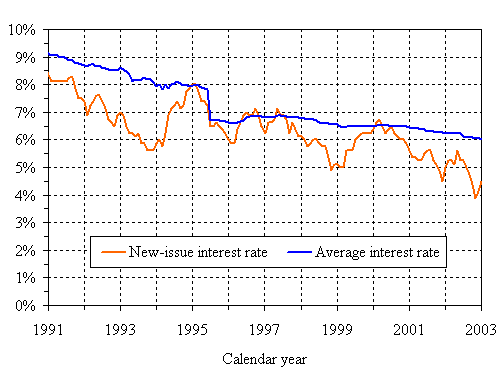
Figure 4 shows a similar comparison for the DI Trust Fund. Prior to June 1995, the average interest rate for DI is approximately the same as that for OASI. Then, in June 1995, the average rate for DI dropped significantly. This drop resulted from the reallocation of the OASI and DI tax rates in 1994. Accounting for the timing of the precipitous drop in the average interest rate on invested DI assets requires some additional comment.
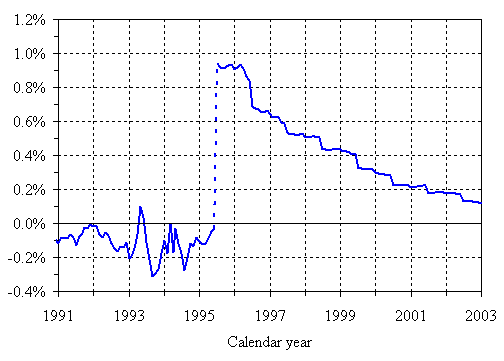
Figure 5 displays the difference in average interest rates earned by the two trust funds. The difference between the average rates for the two funds was very small prior to June 1995. Then the June 1995 rollover brought about the relatively large change in DI average rates, as described above, and the difference between the average rates at the end of June increased to over 0.9 percentage point. Thereafter, the difference declined as both funds redeemed older securities and acquired new securities bearing the same interest rates.
Average time to maturity
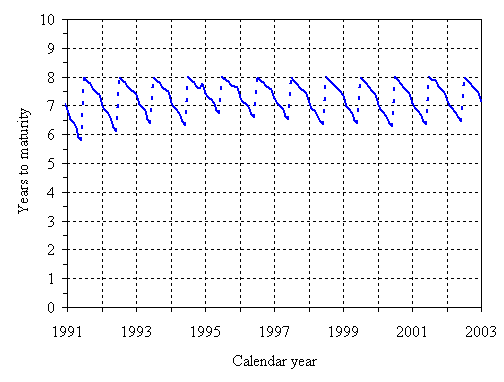
Figure 6 shows the pattern of the average time to maturity4 for the OASI Trust Fund. This sawtooth pattern5 is typical for a fund that is experiencing positive cash-flow balances (given the specific investment policy used for the OASI and DI funds). Under this condition, the rollover policy is to spread the maturity dates of special-issue bonds as evenly as possible over dates of June 30 for each of the next 15 years. Thus, the average time to maturity on that date is about 8 years. (The average time would be exactly 8 years were it not for the fact that all investments are in multiples of a $1,000. As shown in appendix A, the average to three decimal places is 8.000 even with the slight distortion caused when the total asset amount is not evenly divisible by 15.)
Following the June rollover, as CIs that will mature on the next June 30 are acquired, the average time to maturity for the entire trust fund portfolio steadily declines. Because we are graphing monthly (at end of month) results, the figure indicates that the low points in the pattern are reached at the end of each May. However, if we graphed daily (instead of monthly) maturity data, we would see the low points occurring at the end of each June 29.
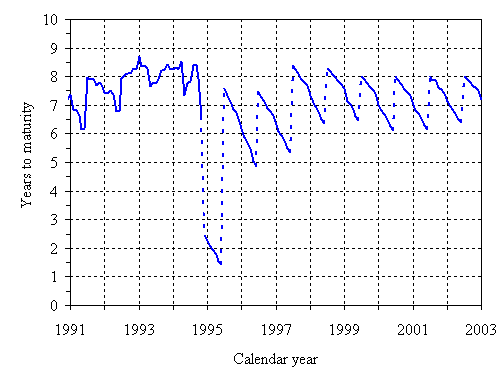
Figure 7 shows the average time to maturity for the DI Trust Fund. Not surprisingly, the financial problem encountered by DI in the early 1990s results in a pattern of changing asset maturities that differs significantly from the regular pattern displayed for OASI in figure 6. The first notable difference occurs during the period July 1992-September 1994. During this period the DI Trust Fund was declining rapidly and the average time to maturity fluctuated within the range of 7.3 to 8.7 years. For all but 2 months of this period (June 1993 and June 1994), the average time to maturity for DI was higher than the corresponding average time for OASI. Factors that account for the differences are as follows.
Second, as bonds were redeemed to cover expenses and new CIs were acquired through current tax income, CIs grew to be a larger proportion (ignoring zero proportions on each June 30) of DI's investment portfolio as compared to OASI's. For example, at the end of July 1992, DI's CI proportion was 10.0 percent of its total portfolio compared to OASI's 4.3 percent, already an indication of DI's bond depletion. At the end of September 1994, DI's proportion was 29.1 percent while OASI's proportion was only 4.9 percent. Thus, with CIs having a time to maturity of less than a year, the relatively higher proportion of CIs held by DI tended to pull down average time to maturity.
Just as the reallocation of tax rates in 1994 had a substantial effect on the average DI interest rate, it also affected the DI average time to maturity. The $14 billion redeemed from OASI and transferred to DI in November 1994 was invested in CIs maturing on the next June 30. As of November 30, 1994, this amount represented 63 percent of DI's investment portfolio and had only 7 months to maturity. Thus, the average time to maturity dropped from almost 6.6 years as of October 31, 1994, to about 2.4 years on November 30, 1994. Under the reallocated tax rates, DI then acquired more CIs and needed to redeem a smaller portion of the CIs that it acquired. Consequently, from November 1994 through May 1995, the average time to maturity slowly declined, reaching a low of approximately 1.4 years by the end of May 1995. Finally, as indicated in figure 7, the sawtooth pattern for the DI Trust Fund after June 1995 became similar to that for the OASI Trust Fund because positive cash flow had been restored by the reallocation.
Conclusion
A study of average interest rates and average time to maturity for 1991-2002 provides insight into the investment operations of the Social Security Trust Funds. In particular, the investment rules and procedures explain the patterns in these two characteristics. Also, adequate financing or lack thereof is shown to have a substantial impact on the characteristics.
APPENDIX A
Note: A new-issue interest rate applies to any new investments throughout a month; an average interest rate and average years to maturity are as of the end of a month.
APPENDIX B
Note: A new-issue interest rate applies to any new investments throughout a month; an average interest rate and average years to maturity are as of the end of a month.
1Actuarial Note 142, Social Security Trust Fund Investment Policies and Practices. This note is available on the Internet at
http://www.socialsecurity.gov/OACT/NOTES/note142.html.
2Available on the Internet at http://www.socialsecurity.gov/OACT/NOTES/note138.html.
3The average is weighted by the amount of securities held at each interest rate.
4 The average is weighted by the amount of securities held at each maturity date.
5 Relatively large changes from the end of one month to the next are indicated with a dashed line.