Skip to content
Social Security Online
History
History Home This is an archival or historical document and may not reflect current policies or procedures
SSA logo: link to Social Security Online home

1983 Greenspan Commission on Social Security Reform


Appendix K to the report of the 1983 Greenspan Commission on Social Security Reform

Appendix K- List of Tables

LIST OF TABLES

1. Summary of current Social Security information.

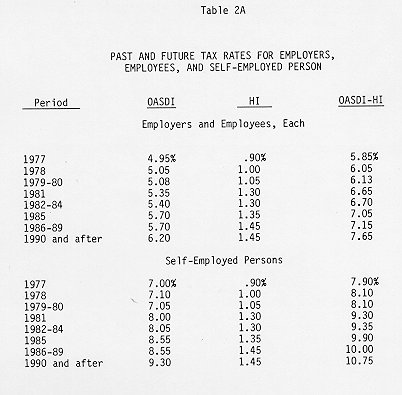
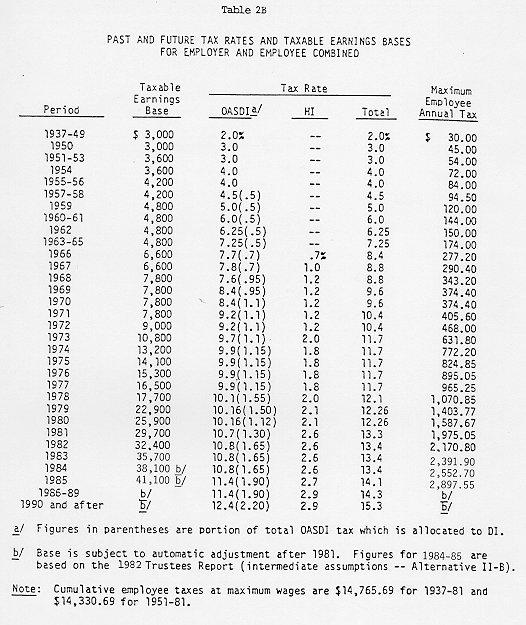
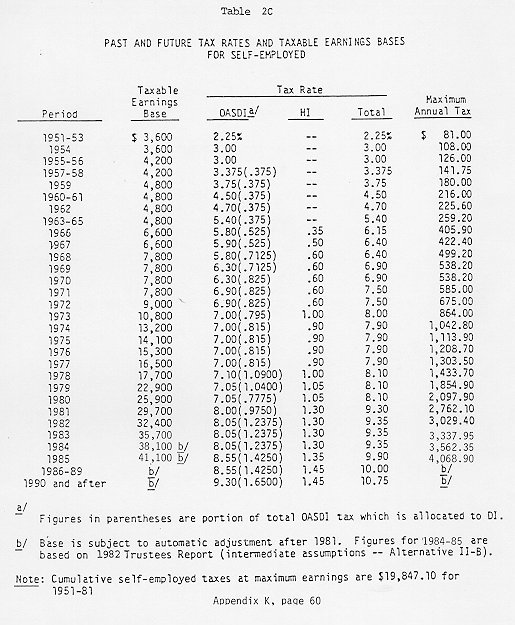
2. Past and future OASDI-HI tax rates and taxable earnings bases
Table A -- employer and employee, each;
Table B -- employer and employee combined;
Table C -- self-employed

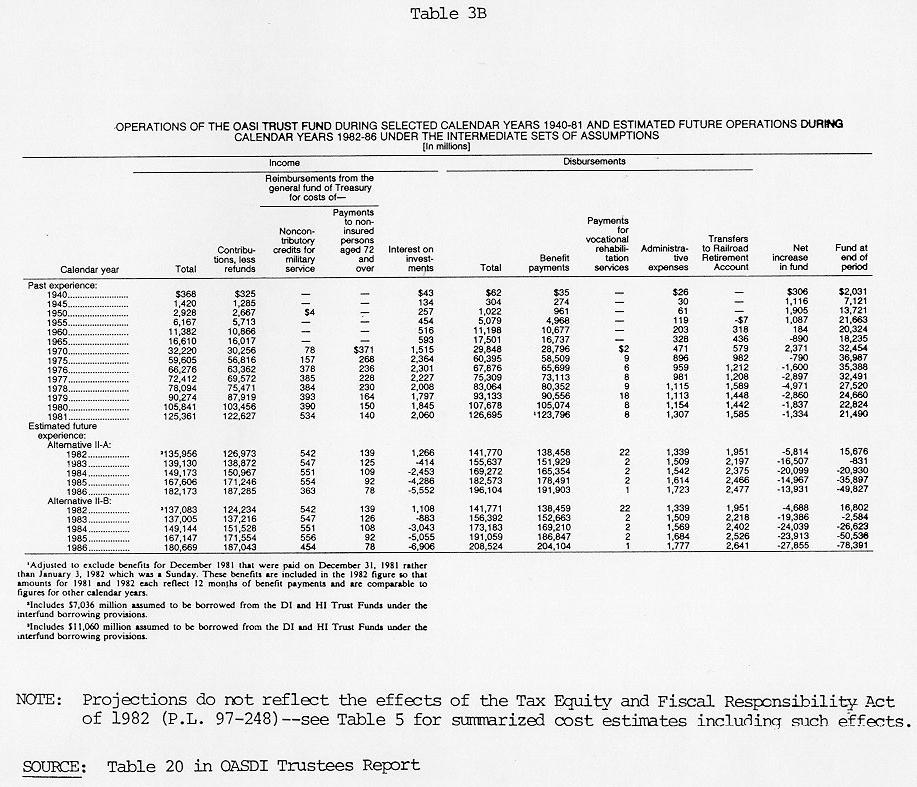
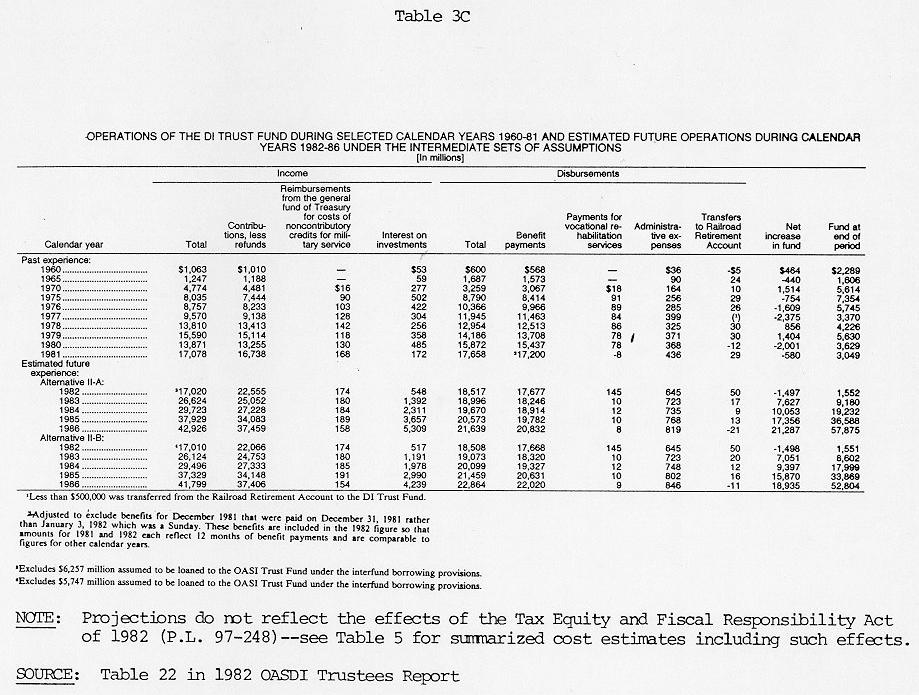
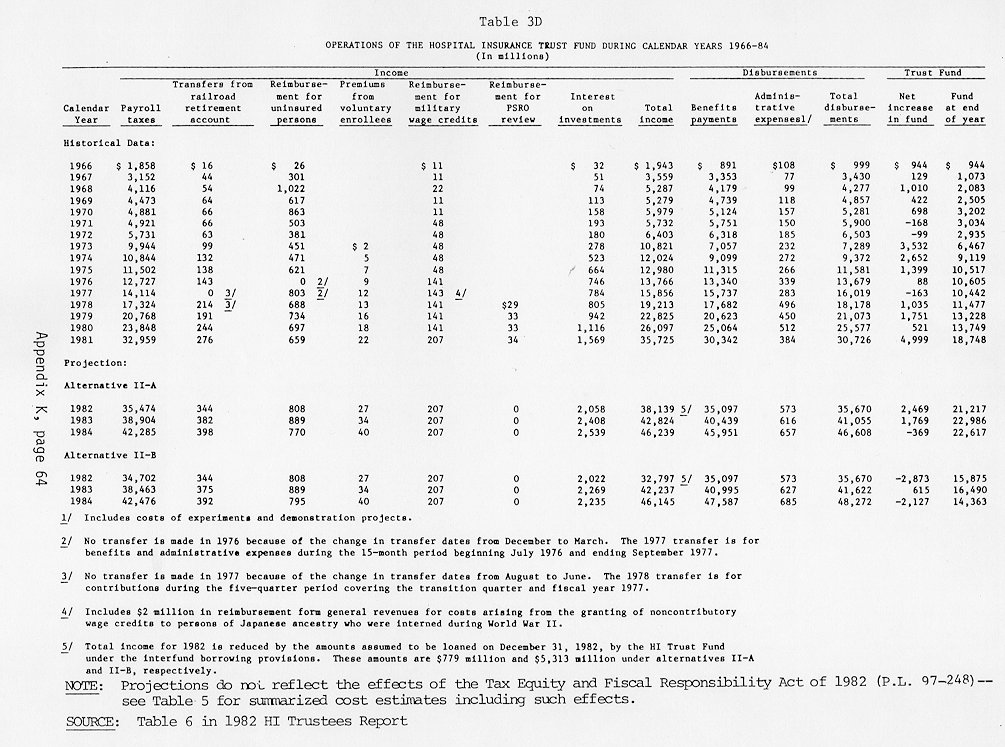
3. Growth of OASDI-HI programs, selected years 1940-81 and estimated future operations during CY 1982-86 under Alternatives II-A and II-B.
Tables A (refers to OASDI)
Table B (refers to OASDI)
Table C (refers to OASDI)
Table D (refers to HI.)

4. Historical trust-fund ratio levels for OASDI, DI, and HI Trust Funds, 1950 to present.

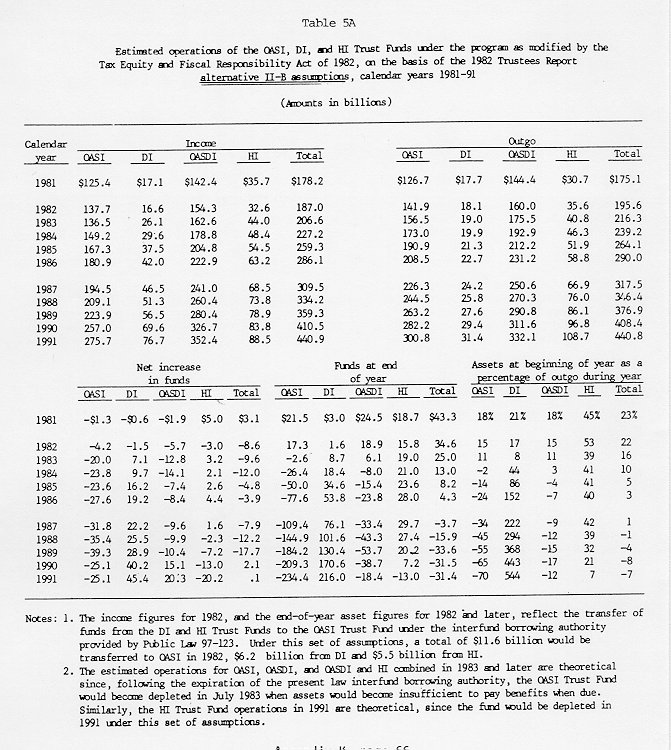
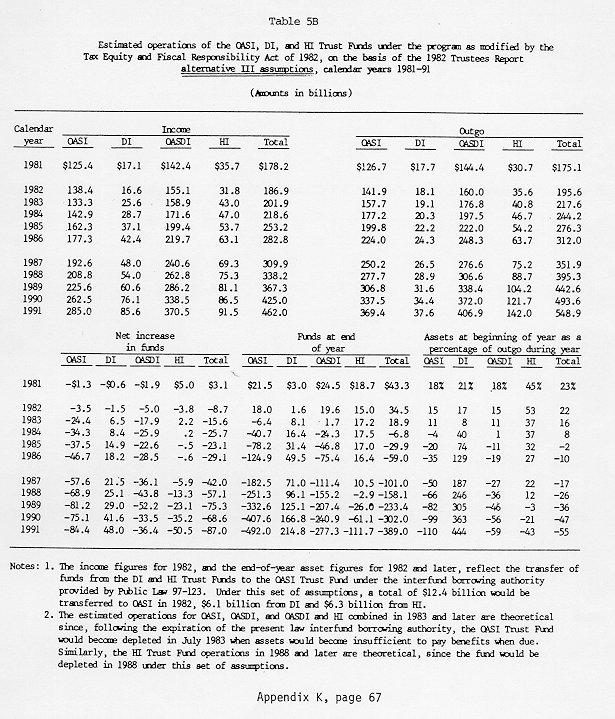
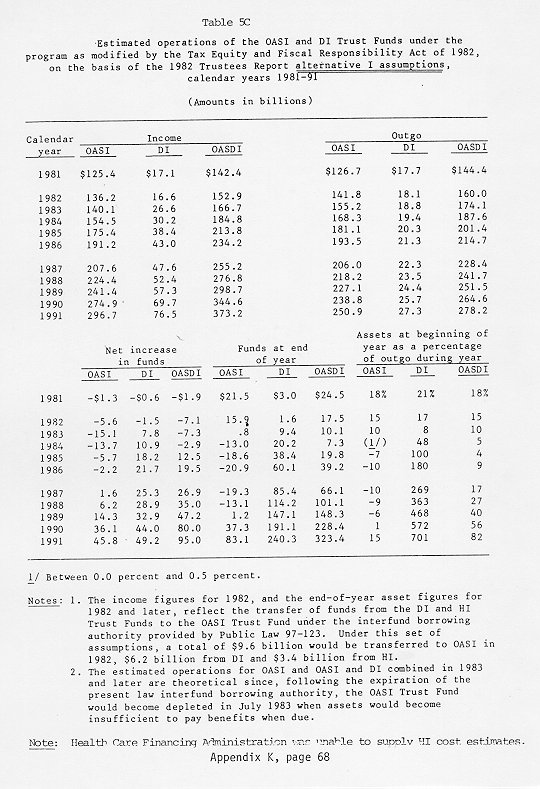
5. Estimated operations of the OASI, DI, and HI Trust Funds in the short range, Alternatives I, II-A, II-B, and III.
Table A
Table B
Table C

6. Long-range status of the OASDI-HI Trust Funds under Alternatives I, II-A, II-B, and III.

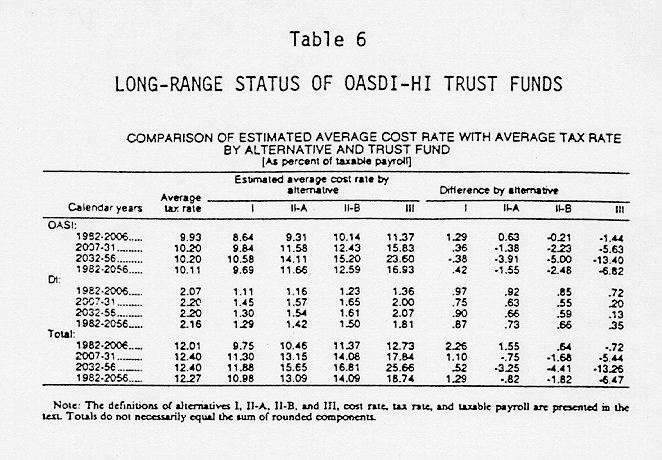
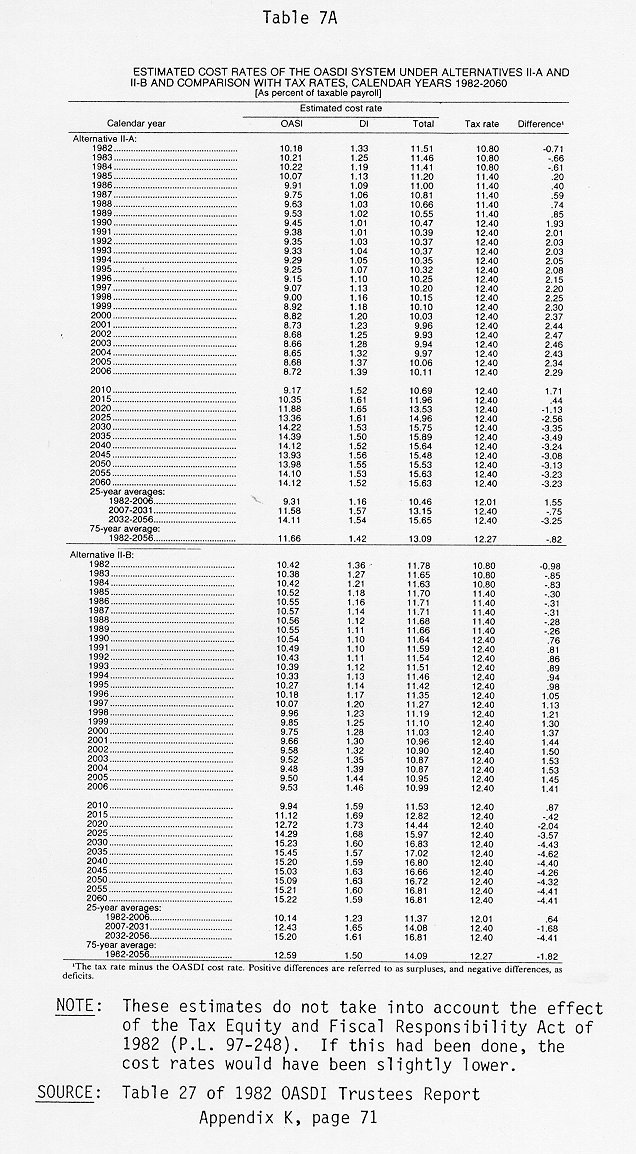
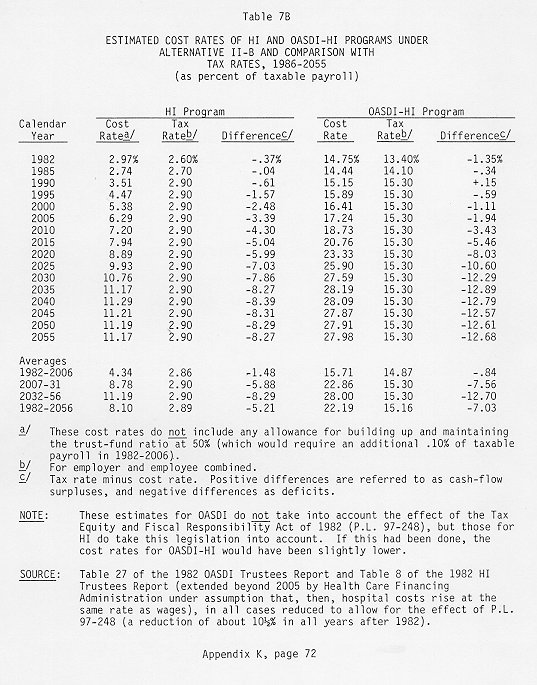
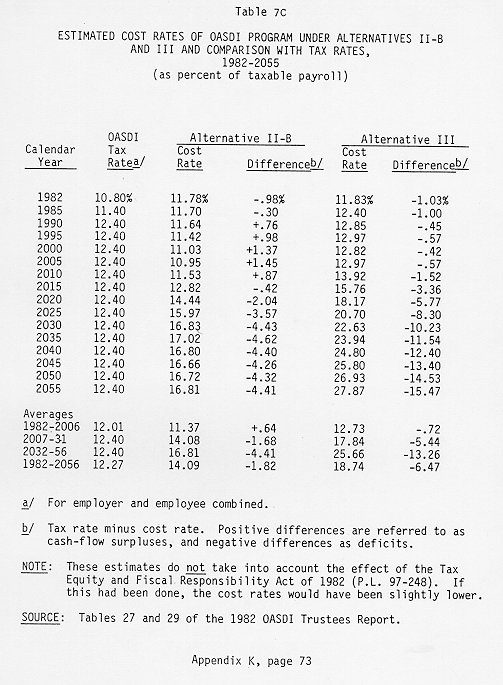
7. Estimated cost rates of the OASDI-HI system under Alternatives II-A, II-B, and III and comparison with tax rates, 1982-2060.
Table A
Table B
Table C

8. Estimated OASI and DI Trust Fund ratios under Alternatives I, II-A, II-B, and III, 1982-2060.

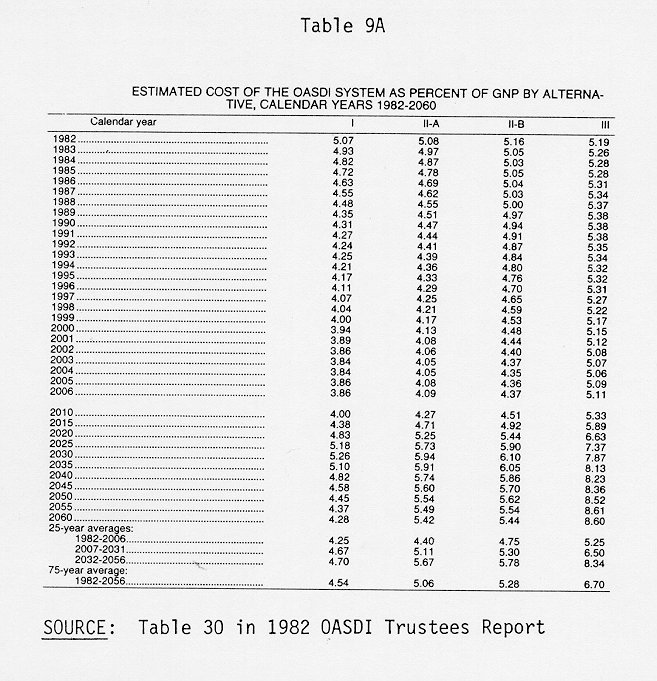
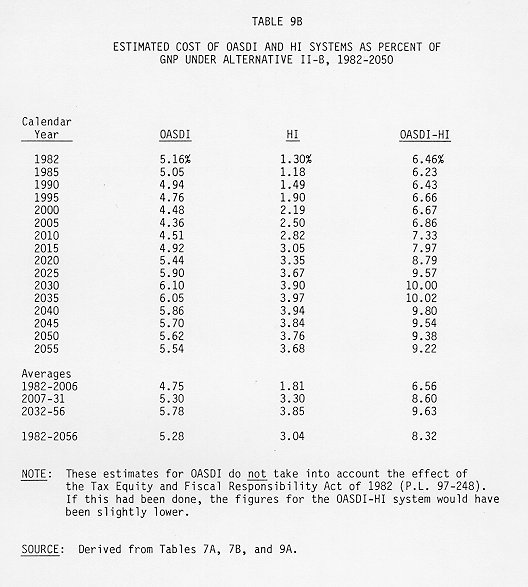
9. Estimated cost of OASDI and HI systems as percent of Gross National Product, 1982-2060. Table A
Table B

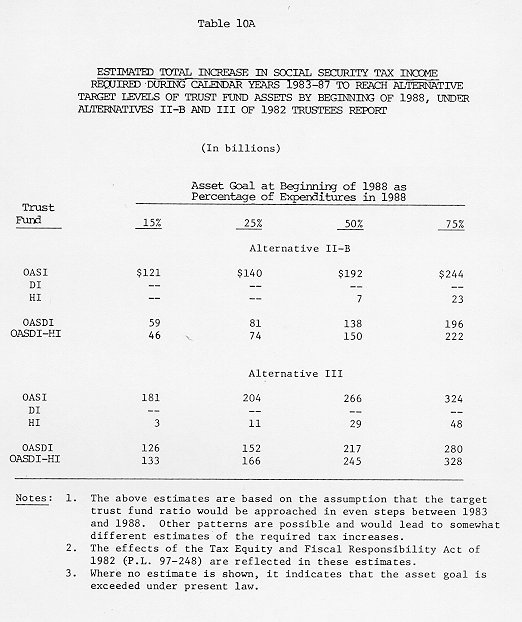
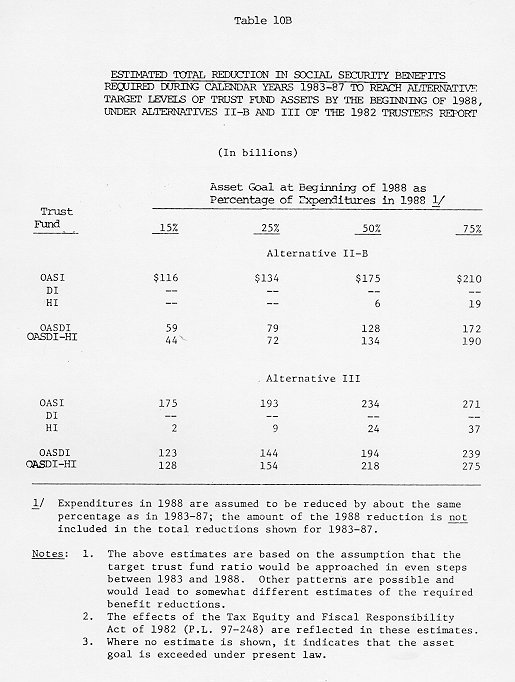
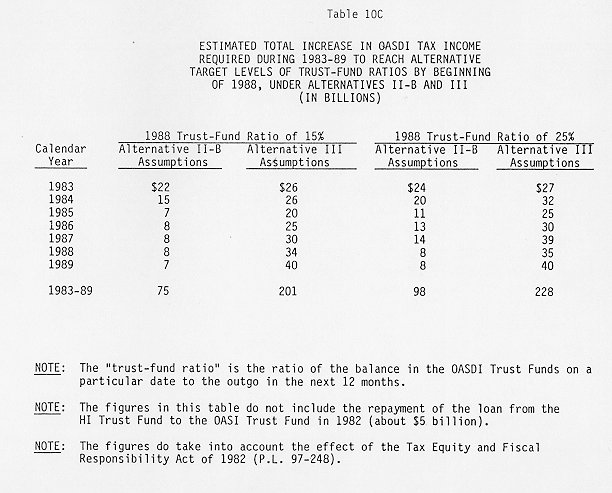
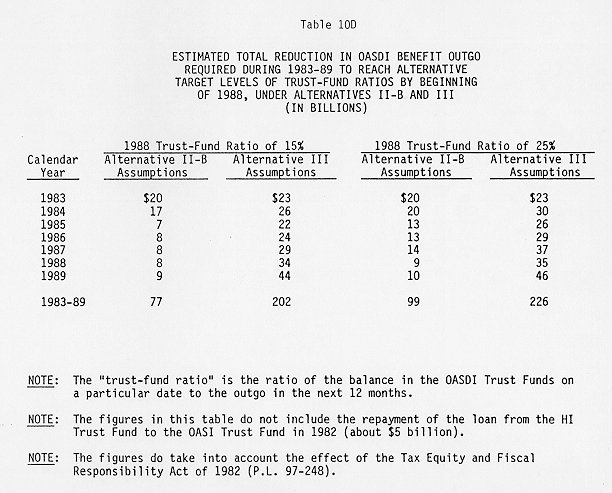
10. Additional resources required under present law in near term to bring OASDI reserves up to certain levels (trust fund ratios of 15%, 25%, 50%, and 75%) under Alternatives II-B and III.
Table A
Table B
Table C
Table D

11. Comparison of OASDI beneficiaries and covered workers; includes worker to beneficiary ratios, historical and projected under Alternatives I, II-A, II-B, and III, 1945-2060.

12. Demographic data -- historical and assumptions under Alternatives I, II-A, II-B, and III regarding total fertility rate and life expectancy (at birth and at age 65), 1940-2060.

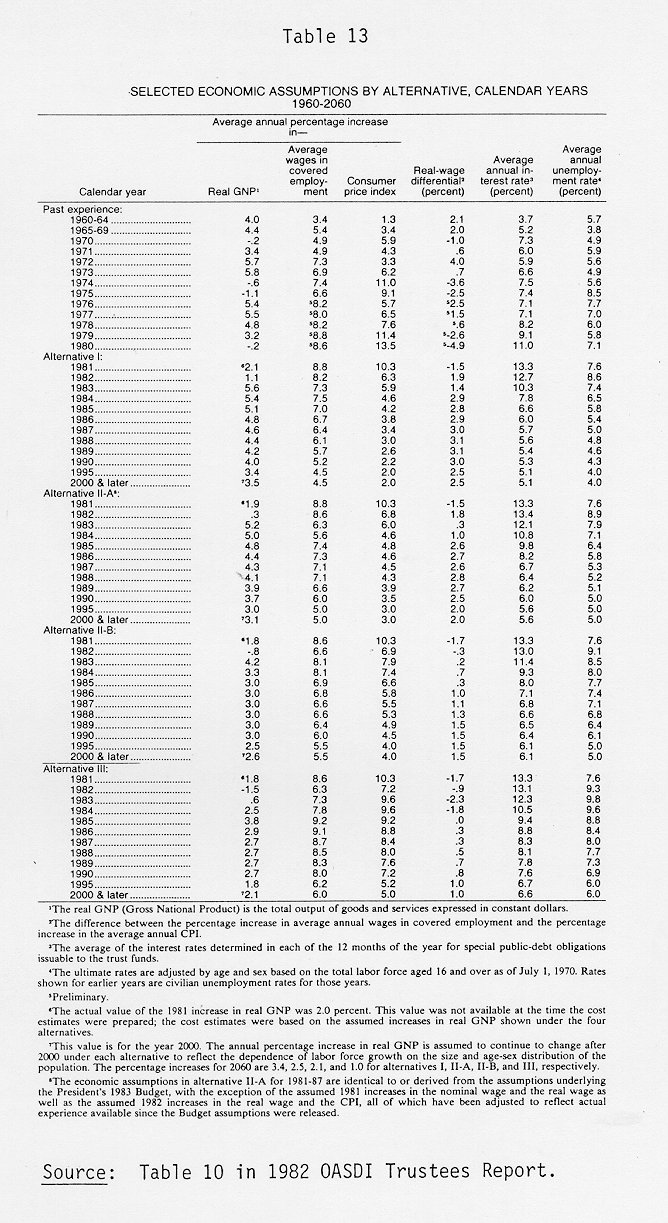
13. Economic data -- historical and assumptions under Alternatives I, II-A, II-B, and III, 1960-2060.

14. Comparison of estimated and actual key economic indicators -- 1972 and 1977 forecasts.

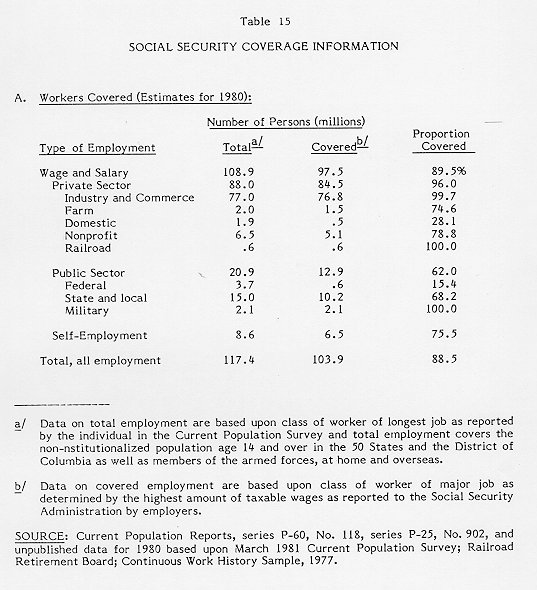
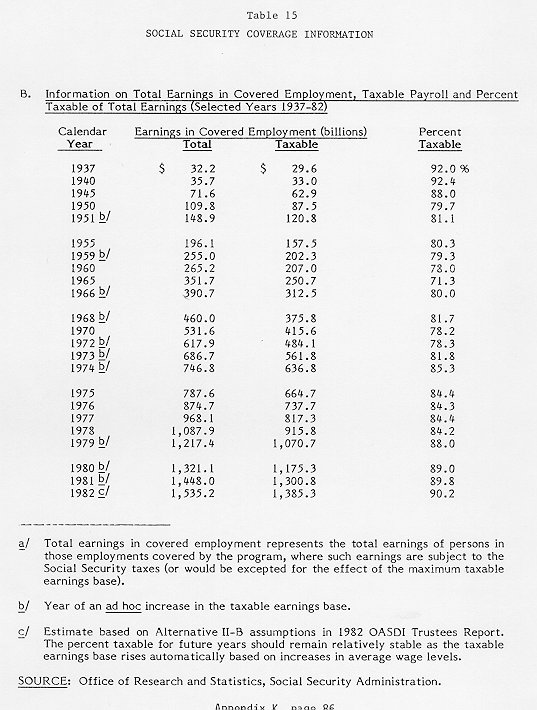
15. Social Security coverage (includes information on percentage of workers covered, percentage of earnings covered and taxable payroll).
Table A
Table B

16. Social Security taxes paid by workers at Federal minimum, average, and maximum wage levels, 1937-90 (employees and the self-employed).

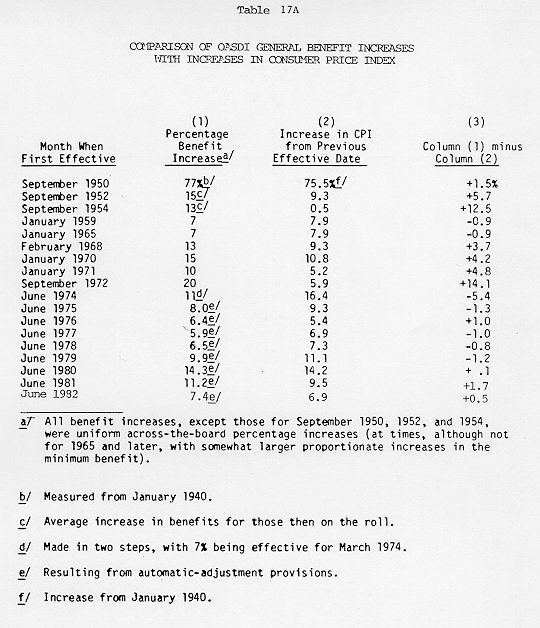
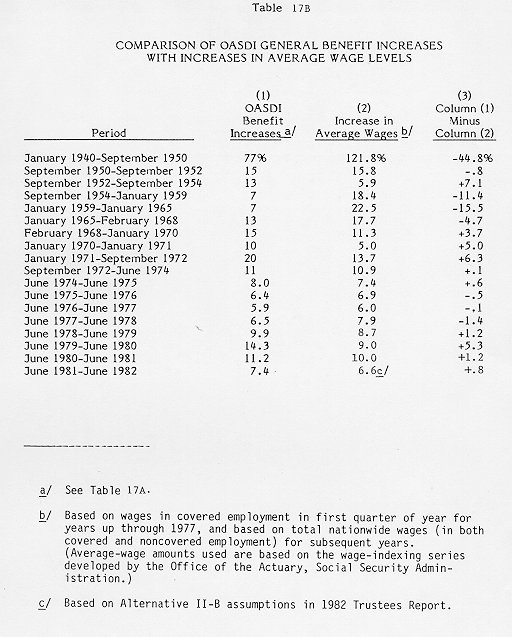
17. Historical comparison of average wage increases and increase in the CPI to Social Security benefit increases.
Tables A
Tables B


 Link to FirstGov.gov: U.S. Government portal Privacy Policy | Website Policies & Other Important Information | Site Map
Need Larger Text?